Download
1 / 74
740 likes | 1.5k Vues
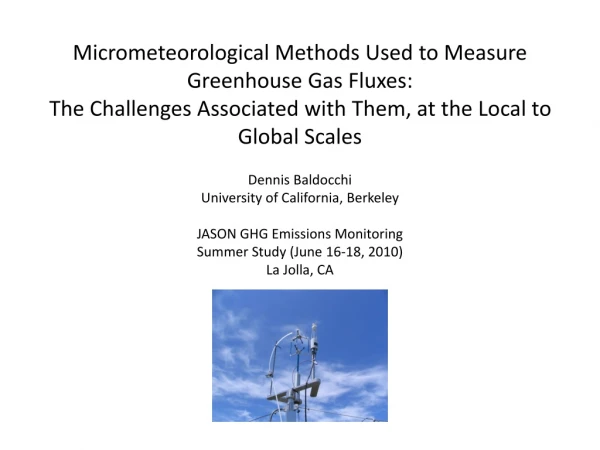
Micrometeorological Methods Used to Measure Greenhouse Gas Fluxes: The Challenges Associated with Them, at the Local to Global Scales. Dennis Baldocchi University of California, Berkeley JASON GHG Emissions Monitoring Summer Study (June 16-18, 2010) La Jolla, CA.

E N D
Micrometeorological Methods Used to Measure Greenhouse Gas Fluxes: The Challenges Associated with Them, at the Local to Global Scales Dennis Baldocchi University of California, Berkeley JASON GHG Emissions Monitoring Summer Study (June 16-18, 2010) La Jolla, CA
Methods To Assess Terrestrial Carbon Budgets at Landscape to Continental Scales, and Across Multiple Time Scales GCM Inversion Modeling Eddy Flux Measurements/ FLUXNET Remote Sensing/ MODIS Forest/Biomass Inventories Physiological Measurements/ Manipulation Expts. Biogeochemical/ Ecosystem Dynamics Modeling
From point to globe via integration with remote sensing (and gridded metorology) forestinventoryplot century Forest/soil inventories decade Landsurface remote sensing Eddycovariancetowers talltowerobser- vatories remote sensingof CO2 year Temporal scale month week day hour local 0.1 1 10 100 1000 10 000 global Countries plot/site EU Spatial scale [km] From: Markus Reichstein, MPI
Challenges in Measuring Greenhouse Gas Fluxes • Measuring/Interpreting greenhouse gas flux in a quasi-continuous manner for days, years and decades • Measuring/Interpreting fluxes over Patchy, Microbially-mediated Sources (e.g. CH4, N2O) • Measuring/Interpreting fluxes of Temporally Intermittent Sources (CH4, N2O, O3, C5H8) • Measuring/Interpreting fluxes over Complex Terrain • Developing New Sensors for Routine Application of Eddy Covariance, or Micrometeorological Theory, for trace gas Flux measurements and their isotopes (CH4, N2O,13CO2, C18O2) • Measuring fluxes of greenhouse gases in Remote Areas without ac line power
Flux Methods Appropriate for Slower Sensors, e.g. FTIR • Relaxed Eddy Accumulation • Modified Gradient Approach • Integrated Profile • Disjunct Sampling
Eddy Covariance • Direct Measure of the Trace Gas Flux Density between the atmosphere and biosphere, mole m-2 s-1 • Introduces No Sampling artifacts, like chambers • Quasi-continuous • Integrative of a Broad Area, 100s m2 • In situ ESPM 228 Adv Topics Micromet & Biomet
Eddy Covariance, Flux Density: mol m-2 s-1 or J m-2 s-1 ESPM 228 Adv Topics Micromet & Biomet
Eddy Covariance Tower Sonic Anemometer, CO2/H2O IRGA, inlet for CH4 Tunable diode laser spectrometer & Meteorological Sensors
24 Hour Time Series of 10 Hz Data, Vertical Velocity (w) and Methane (CH4) Concentration D164, 2008 Sherman Island, CA: data of Detto and Baldocchi
Non-Dispersive Infrared Spectrometer, CO2 and H2O Open-path , 12.5 cm Low Power, 10 W Low noise, CO2: 0.16 ppm; H2O: 0.0047 ppth Low drift, stable calibration Low temperature sensitivity: 0.02%/degree C LI 7500
Measuring Methane with Off-Axis Infrared Laser Spectrometer Closed path Moderate Cell Volume, 400 cc Long path length, kilometers High power Use: Sensor, 80 W Pump, 1000 W; 30-50 lpm Low noise: 1 ppb at 1 Hz Stable Calibration Los Gatos Research
LI-7700 Methane Sensor, variant of frequency modulation spectroscopy Open path, 0.5 m Short optical path length, 30 m Low Power Use: 8 W, no pump Moderate Noise: 5 ppb at 10 Hz Stable Calibration
Power Spectrum defines the Frequencies to be Sampled Power Spectrum Co-Spectrum ESPM 228 Adv Topics Micromet & Biomet
Signal Attenuation:The Role of Filtering Functions and Spectra • High and Low-pass filtering via Mean Removal • Sampling Rate (1-10Hz) and Averaging Duration (30-60 min) • Digital sampling and Aliasing • Sensor response time • Sensor Attenuation of signal • Tubing length and Volumetric Flow Rate • Sensor Line or Volume averaging • Sensor separation • Lag and Lead times between w and c ESPM 228 Adv Topics Micromet & Biomet
Comparing Co-spectra of open-path CO2 & H2O sensor and closed-path CH4 sensor Co-Spectra are More Forgiving of Inadequate Sensor Performance than Power Spectra Because there is little w-c correlation in the inertial subrange M.Detto and D. Baldocchi
Co-Spectra is a Function of Atmospheric Stability: Shifts to Shorter Wavelengths under Stable Conditions Shifts to Longer Wavelengths under Unstable Conditions Detto, Baldocchi and Katul, Boundary Layer Meteorology, accepted
Zero-Flux Detection Limit, Detecting Signal from Noise rwc ~ 0.5 sch4~ 0.84 ppb sco2 ~ 0.11 ppm ESPM 228 Adv Topics Micromet & Biomet
Flux Detection Limit, v2 Based on 95% CI that the Correlation between W and C that is non-zero 0.035 mmol m-2 s-1, 0.31 mmol m-2 s-1 and 3.78 nmol m-2 s-1 for water vapour, carbon dioxide and methane flux, Detto et al, in prep
Most Sensors Measure Mole Density, Not Mixing Ratio Formal Definition of Eddy Covariance, V2 ESPM 228 Adv Topics Micromet & Biomet
Webb, Pearman, LeuningAlgorithm: ‘Correction’ for Density Fluctuations when using Open-Path Sensors ESPM 228 Adv Topics Micromet & Biomet
Raw <w’c’> signal, without density ‘corrections’, will infer Carbon Uptake when the system is Dead and Respiring ESPM 228 Adv Topics Micromet & Biomet
Density ‘Corrections’ Are More Severe for CH4 and N2O: This Imposes a Need for Accurate and Concurrent Flux Measurements of H and LE
Annual Time Scale, Open vs Closed sensors Hanslwanter et al 2009 AgForMet ESPM 228 Adv Topics Micromet & Biomet
Towards Annual SumsAccounting for Systematic and Random Bias Errors • Advection/Flux Divergence • U* correction for lack of adequate turbulent mixing at night • QA/QC for Improper Sensor Performance • Calibration drift (slope and intercept), spikes/noise, a/d off-range • Signal Filtering • Software Processing Errors • Lack of Fetch/Spatial Biases • Sorting by Appropriate Flux Footprint • Change in Storage • Gaps and Gap-Filling ESPM 228 Adv Topic Micromet & Biomet
Systematic and Random Errors ESPM 228 Adv Topic Micromet & Biomet
Random Errors Diminish as We Measure Fluxes Annually and Increase the Sample Size, n
Tall Vegetation, Undulating Terrain Short Vegetation, Flat Terrain
Systematic Biases and Flux Resolution: A Perspective • FCO2: +/- 0.3 mmol m-2 s-1 => +/- 113 gC m-2 y-1 • 1 sheet of Computer paper 1 m by 1 m: ~70 gC m-2 y-1 • Net Global Land Source/Sink of 1PgC (1015g y-1): 6.7 gC m-2 y-1
The Real World is Not Kansas, which is Flatter than a Pancake
Eddy Covariance in the Real World ESPM 228 Adv Topics Micromet & Biomet
Diagnosis of the Conservation Equation for C for Turbulent Flow III I II I: Time Rate of Change II: Advection III: Flux Divergence ESPM 228 Adv Topics Micromet & Biomet
Daytime and Nightime Footprints over an Ideal, Flat Paddock Detto et al. Boundary Layer Meteorology, conditionally accepted
Estimating Flux Uncertainties: Two Towers over Rice Detto, Anderson, Verfaillie, Baldocchi, unpublished
Examine Flux Divergence Detto, Baldocchi and Katul, Boundary Layer Meteorology, conditionally accepted
Underestimating C efflux at Night, Under Tall Forests, in Undulating Terrain Baldocchi et al., 2000 BLM
Losses of CO2 Flux at Night: u* correction ESPM 228 Adv Topic Micromet & Biomet
Systematic Biases are an Artifact of Low Nocturnal Wind Velocity Friction Velocity, m/s
Annual Sums comparing Open and Closed Path Irgas Hanslwanter et al 2009 AgForMet ESPM 228 Adv Topics Micromet & Biomet
Biometric and Eddy Covariance C Balances Converge after Multiple Years Gough et al. 2008, AgForMet
Contrary Evidence from Personal Experience:Crops, Grasslands and Forests
Many Studies Don’t Consider Heat Storage of Forests Well, or at All, and Close Energy Balance when they Do Lindroth et al 2010 Biogeoscience Haverd et al 2007 AgForMet ESPM 228 Adv Topic Micromet & Biomet
Limits and Criteria for Network Design for Treaty Verification • Can We Statistically-Sample or Augment Regional, Continental and Global Scale C Budgets with a Sparse Network of Flux Towers? • If Yes: • How Many Towers are Enough? • Where Should the Towers Be? • How Good is Good Enough with regards to Fluxes? • How Long Should We Collect Data?
How many Towers are needed to estimate mean NEE, GPP and assess Interannual Variability, at the Global Scale? Green Plants Abhor a Vacuum, Most Use C3 Photosynthesis, so we May Not need to be Everywhere, All of the Time We Need about 75 towers to produce Robust and Invariant Statistics
Probability Distribution of Published NEE Measurements, Integrated Annually Baldocchi, Austral J Botany, 2008
Interannual Variability of the Statistics of NEE is Small across a sub-network of 75 Sites Mean NEE Ranges between -220 to -243 gC m-2 y-1 Standard Deviation Ranges between 35.2 and 39.9 gC m-2 y-1
Interannual Variability in GPP is small, too, across the Global Network (1103 to 1162 gC m-2 y-1) Assuming Global Arable Land area is 110 106 km2, Mean Global GPP ranges between 121.3 and 127.8 PgC/y Precision is about +/- 7 PgC/y
Ecosystem Respiration Scales Tightly with Ecosystem Photosynthesis, But Is with Offset by Disturbance Baldocchi, Austral J Botany 2008
Net Carbon Exchange is a Function of Time Since Disturbance Baldocchi, Austral J Botany, 2008