Download
1 / 188
1.89k likes | 1.92k Vues
Explore the fascinating realms of biodiversity and evolution, crucial for Earth's life forms. Learn how to measure and maintain biodiversity levels across various habitats.

E N D
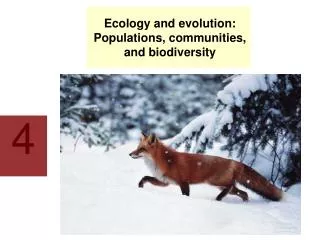
Biodiversity and evolution • Evolution has generated a very wide variety of organisms. • The fact that all organisms share a common ancestry allows them to be classified. • There is increasing recognition of the need to maintain biodiversity.
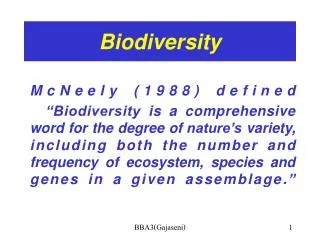
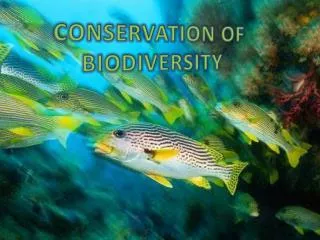
Biodiversity • Biodiversity is an important indicator in the study of habitats.
Classification • Classification is an attempt to impose a hierarchy on the complex and dynamic variety of life on Earth. • Classification systems have changed and will continue to change as our knowledge of the biology of organisms develops.
Evolution • “Nothing in biology makes sense except in the light of evolution” • Theodosius Dobzhansky, 1973.
Maintaining Biodiversity • Maintaining biodiversity is important for many reasons. • Actions to maintain biodiversity must be taken at local, national and global levels.
2.3.1. Biodiversity Module 3: Biodiversity and Evolution
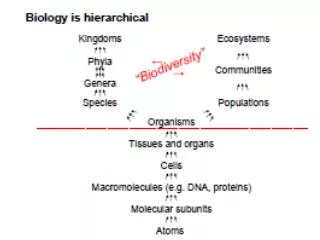
Learning Outcomes • define the terms ‘species’, ‘habitat’ and ‘biodiversity’ • explain how biodiversity may be considered at different levels; • habitat, • species • genetic
Biodiversity • The biodiversity of an area is a measure of: • Different ecosystems • Number of species • Number of individuals of each species
Biodiversity • “structural and functional variety in the living world” • Levels of biodiversity • Range of habitats in which different species live • The differences between species • Genetic variation between individuals of the same species
Species - definition • Species “a group of organisms, with similar morphological, physiological, biochemical and behavioural features, which can interbreed to produce fertile offspring, and are reproductively isolated from other species” • This often leads to disagreements and uncertainties when classifying or identifying species
Group of organisms Capable of interbreeding Capable of producing fertile offspring Reproductively isolated from other groups “biospecies” Group of organisms showing similarities in characteristics Morphological Physiological biochemical Ecological behavioural Species – the two groups of criteria
Habitat – definition • A habitat is the place where individuals in a species live. • Organisms show adaptations to their habitat • A full description of the habitat includes the physical and biological factors that characterise that environment
Examples of habitats • Name of the place • A description of dominant vegetation • Coniferous forest • Oak woodland • Tropical rainforest • Grassland • A type of environment • Freshwater pond • Rock pool on a rocky shore
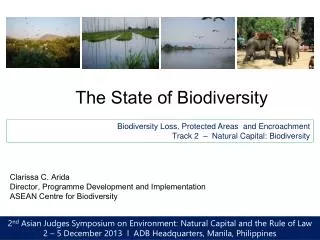
The State of the planet • David Attenborough presents a series of three programmes looking at the “state of the planet” to address the concern below. • One species (humans) can so alter its environment that it can destroy whole species, and indeed whole environments. • How great is the damaged that is being caused? • Why is it that what we do is so destructive? • What can we do to change?
The state of the planetProgramme No. 1 • The Biodiversity on Earth • In order to understand the impact that humans are having on the environment we first need to understand the variety of life on the planet, the biodiversity. • Watch the DVD and answer the questions on the worksheet. • After watching the DVD write out your thoughts on the statement • Why conserve ecosystems?
explain the importance of sampling in measuring the biodiversity of a habitat describe how random samples can be taken when measuring biodiversity Measuring Biodiversitylearning Outcomes
Measuring biodiversity • To measure biodiversity you need to find out • What species are present • The abundance of each species • The distribution of each species across the area • Compile a species list • Identification keys • Observation • Trapping of mobile animals
Measuring biodiversity • Distribution • Where the species is found • Abundance • How many of each species are present • Estimating abundance • Take a representative sample • Multiply up
Random sampling • Study a small part of the habitat • Sample sites must be selected at random • Take samples at regular intervals • Use random number tables • Select co-ordinates from a map
Number of samples • The number of samples taken will depend on • The size of the habitat • The time of year • The diversity of the habitat being studied
Recording results • Prepare a table • Space for all species • Space to record the data for each sample site
Sampling techniques • Quadrats • Choose a suitable quadrat size • Place quadrat at random • Identify plants • Measure their abundance • Transects • Put a tape measure across the habitat • Record all species touching the line • Can record at intervals
Belt transect Interrupted belt transect Continuous belt transect Used to survey rocky shores or sand dunes Interrupted belt transect continuous belt transect Sampling techniques
Percentage Cover Proportion of quadrat’s area occupied by the species Grids can help with estimates Use a point frame within a quadrat Include bare ground Abundance scale – subjective ACFOR scales Abundant Common Frequent Occasional Rare Species frequency Proportion of quadrats with the species present Measuring abundance
Rocky Shores Some text, photos and diagrams taken from: Marine Field Course Guide to Rocky Shores (1992) by S.J. Hawkins & H. D. Jones
Learning Outcomes • To understand that zonation occurs on a rocky shore, and the factors that control this distribution • To identify a range of organisms living on a rocky shore • To understand the importance of carrying out biological surveys • To carry out a “paper-based” transect looking at the distribution of organisms on a rocky shore • To present results as a kite diagram, and write a report of their findings.
Rocky Shore Ecology • The seashore is the boundary between land and sea. • A sharp change in environmental conditions occurs between the low tide mark and the splash zone. • Most shore plants and animals have evolved from marine ancestors.
Zonation • Biomass, biodiversity and community complexity increases towards the lower shore as conditions are better for marine organisms; competition for space and food is intense. • Species occur in distinct communities or horizontal bands on the shore known as zonation.
Splash zone As you can see from these diagrams organisms show zonation. You can also see that the organisms present varies according to the exposure of the shore. Low tide
Activity • For each zone write in the degree of stress for each abiotic and biotic factor • Add on two arrows to show the direction of increasing stress caused by abiotic (red) and biotic (green) factors on the rocky shore
Factors affecting the distribution of organisms • Survival is most difficult near the top of the shore. • Biomass and biodiversity of animals and plants is low. • Those plants and animals that can survive have little competition e.g. for space, and may be abundant.
Rocky Shore Transect • On the A4 “rocky shore” draw a belt transect using 3cm2 quadrats. • Calculate the abundance of each species of “plant” and “animal” in each quadrat, record your results in the table provided. • Write a report on the distribution of organisms on the rocky shore • Extension Activity • Present your results as a kite diagram for five seaweeds and five animals.
Sampling in School Grounds • Suggested activities • Transect in grass outside chapel • Random quadrat sampling of two sites • Optimum quadrat size for pinkie fields • Optimum quadrat number • Species frequency on pinkie fields • Comparison of percentage cover and ACFOR • All students quantify the same 10 quadrats and allow for comparison
If the animals are mobile Observation Observation of signs left behind Owl pellets, droppings, burrows etc Catch or trap animals and estimate numbers from the trapped sample Catching animals Sweep netting Kick sampling Tree sampling Pitfall trap Tulgren funnel Light trap Sampling Animals
Surveying school grounds • Suitable methods that could be used in school include • Sweep netting in the long grass • Tree sampling • Pitfall trap • Tulgren funnel • To allow for a comparison, each sample should be done at two sites, and some abiotic readings should be taken.
Summary of the impact of sampling • Sampling may cause damage to a habitat • Temporary disturbance • Long term disturbance • Example • Trampling • Digging for pitfall traps etc
Why do we need to study habitats? • Assess human impact • EIA – Planning process • To highlight the importance of maintaining habitats and reducing the damage
Learning Outcomes • describe how to measure species richness and species evenness in a habitat • Use Simpson's Index of diversity (D) to calculate the biodiversity of a habitat using the formula D = 1 – (∑(n/N)2) • Outline the significance of both high and low values of Simpson’s Index of Diversity (D)
Measuring Biodiversity • Species richness • Number of species present in the study area • Species evenness • Measure the abundance of individuals in each species • Increasing species richness and species evenness will increase biodiversity
Simpson’s diversity Index • Measure of biodiversity taking into account species richness and species evenness • Formula • D = 1 – [∑(n/N)2] • n = number of individuals of a particular species • N = total number of all individuals of all species
Progress Question • Use Simpson’s index to calculate the diversity of a habitat that contains the following organisms • 20 woodlice • 5 mice • 1 shrew • 32 earthworms • 15 grasshoppers • 1 owl • Comment on the diversity of this habitat
Answers to progress questions • D = 1 – 0.306 • D = 0.694
2.3.2 Classification Module 3: Biodiversity and evolution
Classification • Classification is an attempt to impose a hierarchy on the complex and dynamic variety of life on Earth. • Classification systems have changed and will continue to change as our knowledge of the biology of organisms develops.
Learning Outcomes • Define the terms classification, phylogeny and taxonomy. • Explain the relationship between classification and phylogeny. • Describe the classification of species into the taxonomic hierarchy of domain, kingdom, phylum, class, order, family, genus and species.
Definitions • Classification • The grouping of organisms into categories based on various features • Phylogeny • Study of evolutionary relationships between organisms • Taxonomy • The study of the principles of classification • Taxon • Classificatory group
Natural Classification • Concept of the species • Capable of breeding to produce fertile offspring • Have common ancestry • Have very similar genes • Hierarchy of classification • Closely related species are placed together in groups • Closely related groups are placed together in a larger group • Modern classification reflects the evolutionary distance between species