Download
1 / 42
420 likes | 451 Vues
The BEST Trial compared everolimus-eluting stents with bypass surgery for coronary disease. Primary endpoint was major adverse cardiac events over 2 years. Non-inferiority testing showed PCI was 3.1% higher than CABG. Long-term follow-up data showed a cumulative incidence difference. Statistical methods included Kaplan-Meier survival analysis and Cox regression modeling.

E N D
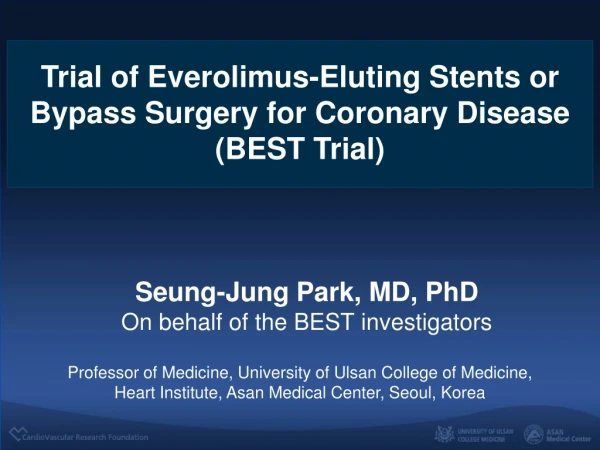
Trial of Everolimus-Eluting Stents or Bypass Surgery for Coronary Disease (BEST Trial) Seung-Jung Park, MD, PhD On behalf of the BEST investigators Professor of Medicine, University of Ulsan College of Medicine, Heart Institute, Asan Medical Center, Seoul, Korea
Background Recent studies have demonstrated that the rates of most adverse clinical outcomes in patients with multivessel coronary-artery disease are lower following CABG than with PCI. However, previous studies may have been limited by their use of first-generation drug-eluting stents.
BEST Trial Design • DESIGN: A prospective, open-label, randomized trial • OBJECTIVE: To compare PCI with everolimus-eluting stents and CABG for optimal revascularization of patients with multivessel coronary artery stenosis. • PRINCIPAL INVESTIGATOR • Seung-Jung Park, MD, PhD, Asan Medical Center, Seoul, Korea
Major Inclusion Criteria 18 years of age. Angiographically confirmed mutivessel coronary artery disease (>70%) Suitable candidates for either PCI or CABG by their treating physicians and surgeons Symptoms of angina and/or objective evidence of myocardial ischemia.
Major Exclusion Criteria Any contraindication to dual antiplatelet therapy Severe heart failure (NYHA III or IV) Planned surgery Previous CABG Prior PCI with DES implantation within 1 year CTO ≥2 STEMI within 72 hours Elevated cardiac enzyme Disabled stroke Other comorbidity
Study Procedures Everolimus-Eluting Xience Stent for all lesions Strong recommendation of IVUS-guidance Other adjunctive devices at the physician’s discretion Use of LIMA to LAD anastomosis Off- or on-pump surgery at the surgeon’s discretion DAPT at least for 1 year after PCI Standard medical treatment after PCI and CABG
Follow-up Clinical follow-up at 30 days and 6, 9, and 12 months , and annually thereafter, via clinic visit or telephone interview. Secondary preventive medication was strongly recommended according to clinical guideline Routine angiographic follow-up was strongly discouraged for all patients to reduce the occurrence of repeat revascularization driven by angiography alone without evidences of ischemia.
Primary End Point A composite of major adverse cardiac events (MACE) at the 2 years after randomization including Death from any cause Myocardial infarction ≤48 h: New Q waves and CK-MB > 5 times >48 h: Any CK-MB elevation and ischemic symptoms or signs Target vessel revascularization
Original Power Calculation Assumed MACE rate: 12% at 2 years A noninferiority margin : 4% A one-sided type I error rate : 0.05 Power : 80% Dropout rate: 5% Assumed sample size: 1776 patients Non-inferiority Design for Primary Endpoint
Premature Termination of Trial • The enrollment rate was slower than expected, which was thought to be a consequence of the rapid spread of measurement of fractional flow reserve in clinical practice. • The data and safety monitoring board recommended stopping enrollment in October 2013 when 880 patients had been enrolled. • We extended the follow-up period with a median of 4.6 years.
Patient Flow 4654 patients were screened Between July 2008 and September 2013 1725 patients were eligible 880 patients consented and enrolled PCI (n=438) Treated PCI: 413 Treated CABG: 9 Treated medically: 6 CABG (n=442) Treated CABG: 382 Treated PCI: 51 Treated medically: 9 1 Year FU (N=442) 1 Year FU (N=438) 3 Year FU (N=369) 3 Year FU (N=373) 5 Year FU (N=172) 5 Year FU (N=171) Lost to Follow-up At 5 year 1 patient 2 patients
Statistical Analysis Kaplan-Meier method to estimate survivals with comparison using log-rank test. Noninferiority test using the Z-test with 95% CI of difference in the 2-year MACE rate. Survival analyses for longer-term outcomes using all available follow-up data as an exploratory analyses. Subgroups analysis using the Cox regression model with tests for interaction. Primary analysis in intention-to-treat principle
Aspirin Thienopyridine Medication at Follow-Up PCI CABG % % Statin Beta blocker % %
Procedural Characteristics* * Data were summarized according to the as-treated analysis † P<0.05 between PCI and CABG group
Noninferiority Test for Primary End Point 2-year MACE rate, PCI: 11.0% CABG: 7.9% Prespecified non-inferiority margin: 4% Non-inferiority P=0.32 Absolute Risk Difference 3.1% points 95% CI -0.8-6.9 Difference (percentage point) of 2-year MACE rate (PCI – CABG) Upper 1-sided 95% CI
Primary End Point PCI 30 CABG 25 Log-rank P=0.043 20 17.0% Cumulative Incidence, % 15 11.7% 10 5 0 0 1 2 3 4 5 Years Since Randomization No. at Risk PCI 438 402 362 305 242 126 CABG 442 415 326 262 145 377 Event rates were derived from Kaplan-Meier estimates
Death, MI or Stroke PCI 30 CABG 25 Log-rank P=0.26 20 Cumulative Incidence, % 15 13.4% 10.2% 10 5 0 0 1 2 3 4 5 Years Since Randomization No. at Risk PCI 438 413 373 318 255 133 CABG 442 419 329 263 144 381 Event rates were derived from Kaplan-Meier estimates
Death PCI 30 CABG 25 Log-Rank P=0.30 20 Cardiac Death: HR 1.15 (0.58-2.25), P=0.69 Non-Cardiac Death: HR 1.87 (0.69-5.05), P=0.21 Cumulative Incidence, % 15 10 7.5% 5 5.5% 0 0 1 2 3 4 5 Years Since Randomization No. at Risk PCI 438 426 387 333 268 146 CABG 442 433 346 278 154 397 Event rates were derived from Kaplan-Meier estimates
Myocardial Infarction PCI 30 CABG 25 Log-Rank P=0.11 20 Cumulative Incidence, % 15 10 5.5% 5 2.8% 0 0 1 2 3 4 5 Years Since Randomization No. at Risk PCI 438 419 382 325 261 140 CABG 442 422 335 271 151 386 Event rates were derived from Kaplan-Meier estimates
Land Mark Analysis of MI PCI CABG 0-30days: HR, 0.67 (95% CI, 0.24-1.88), P=0.44 15 >30 days: HR, 5.04 (95% CI, 1.46-17.4), P=0.004 12 Cumulative Incidence, % 9 6 4.2% 3 0.8% 30days 0 0 1 2 3 4 5 Years Since Randomization Event rates were derived from Kaplan-Meier estimates
Land Mark Analysis of Death PCI CABG 15 0-30days: HR, 0.51 (95% CI, 0.09-2.76), P=0.42 >30 days: HR, 1.53 (95% CI, 0.84-2.78), P=0.16 12 Cumulative Incidence, % 9 7.0% 6 4.6% 3 30days 0 0 1 2 3 4 5 Years Since Randomization Event rates were derived from Kaplan-Meier estimates
Land Mark Analysis of Death and MI PCI CABG 15 0-30days: HR, 0.62 (95% CI, 0.26-1.49), P=0.28 >30 days: HR, 1.69 (95% CI, 0.982.91), P=0.054 12 9.6% Cumulative Incidence, % 9 6 5.5% 3 30days 0 0 1 2 3 4 5 Years Since Randomization Event rates were derived from Kaplan-Meier estimates
Stroke PCI 30 CABG 25 Log-Rank P=0.72 20 Cumulative Incidence, % 15 10 5 3.3% 2.9% 0 0 1 2 3 4 5 Years Since Randomization No. at Risk PCI 438 421 383 326 262 140 CABG 442 427 338 271 152 389 Event rates were derived from Kaplan-Meier estimates
Any Repeat Revascularization PCI 30 CABG Log Rank P=0.003 25 20 Cumulative Incidence, % 15 13.4% 10 6.6% 5 0 0 1 2 3 4 5 Years Since Randomzation No. at Risk PCI 438 393 335 257 164 80 CABG 442 414 286 189 87 365 Event rates were derived from Kaplan-Meier estimates
Target Lesion Revascularization PCI 30 CABG Log Rank P=0.19 25 20 Cumulative Incidence, % 15 10 6.1% 5 4.5% 0 0 1 2 3 4 5 Years Since Randomization No. at Risk PCI 438 408 365 310 247 130 CABG 442 424 334 267 147 386 Event rates were derived from Kaplan-Meier estimates
New Lesion Revascularization PCI 30 CABG Log Rank P=0.013 25 20 Cumulative Incidence, % 15 10 6.5% 5 2.4% 0 0 1 2 3 4 5 Years Since Randomization No. at Risk PCI 438 416 370 317 254 138 CABG 442 427 337 270 149 389 Event rates were derived from Kaplan-Meier estimates
Death, MI, Stroke or Any RR(SYNTAX Primary Endpoint) PCI CABG 30 Log Rank P=0.01 25 21.7% 20 Cumulative Incidence, % 15 14.6% 10 5 0 0 1 2 3 4 5 No. at Risk PCI 438 389 341 288 229 117 CABG 442 409 317 250 137 368 Event rates were derived from Kaplan-Meier estimates
Definite or Probable Stent Thrombosis 5 4 4 Definite ST 3 Probable ST Cumulative Incidence, % 3 2.0% 2 1 0 0 1 2 3 4 5 Years Since Randomzation Event rates were derived from Kaplan-Meier estimates
Subgroups for Primary Endpoint Hazard Ratio (95% CI) P value for Subgroup Primary Outcome Interaction PCI CABG n / total n. ( % ) 1.47 (1.01 - 2.13) - Overall 67/438 (15.3) 47/442 (10.6) 0. 90 Age 1.51 (0.95 - 2.42) 65 yr 41/229 (17.9) 30/252 (11.9) ≥ 1.43 (0.77 - 2.63) <65 yr 26/209 (12.4) 17/190 (8.9) 0.88 Sex 1.43 (0.92 - 2.24) Male 45/304 (14.8) 34/325 (10.5) 1.53 (0.77 - 3.05) Female 22/134 (16.4) 13/117 (11.1) 0. 0 6 Diabetes 2.24 (1.25 - 4.00) Yes 34/177 (19.2) 17/186 (9.1) 1.07 (0.65 - 1.76) No 33/261 (12.6) 30/256 (11.7) 0. 35 ACS 1.30 (0.82 - 2.06) Yes 40/228 (17.5) 33/238 (13.9) 1.89 (0.99 - 3.60) No 27/210 (12.9) 14/204 (6.9) 0. 65 Ejection fraction 40% 7/17 (41.2) 4/17 (23.5) 1.79 (0.51 - 6.21) ≤ >40% 60/421 (14.3) 43/425 (10.1) 1.43 (0.97 - 2.12) Vascular extent 0. 65 3VD 56/330 (17.0) 42/349 (12.0) 1.45 (0.97 - 2.17) 2VD 11/108 (10.2) 5/93 (5.4) 1.89 (0.66 - 5.43) SYNTAX score 0. 2 5 Score 33 13/66 (19.7) 10/79 (12.7) ≥ 1.59 (0.70 - 3.62) Score 23 - 32 30/187 (16.0) 14/177 (7.9) 2.14 (1.13 - 4.03) Score 22 24/185 (13.0) 23/186 (12.4) ≤ 1.04 (0.59 - 1.84) EuroSCORE 0. 65 6 12/51 (23.5) 11/59 (18.6) 1.25 (0.55 - 2.84) ≥ <6 55/387 (14.2) 36/383 (9.4) 1.55 (1.02 - 2.35) 0.1 1 10 PCI better CABG better
Summary Percentages are crude rates throughout the available follow-up period
Conclusion • The BEST trial failed to show that PCI with everolimus-eluting stents was noninferior to CABG with respective to the primary end point of death, myocardial infarction, or target vessel revascularization at 2 years. • At longer-term follow-up (median 4.6 years), PCI was associated with a significant increase in the incidence of the primary end point compared with CABG.
Myocardial Infarction PCI CABG P=0.48 P=0.02 Crude Incidence, % Q wave plus CK-MB>5 Times Ischemic Sx or Sign plus CK-MB elevation Percentages are crude rates throughout the available follow-up period
Noninferiority Test for Primary End Point 2-year MACE rate PCI: 11.2% CABG: 7.5% Prespecified non-inferiority margin: 4% Non-inferiority P=0.44 Absolute Risk Difference 3.7% points 95% CI -0.2-7.6 Difference (percentage point) of 2-year MACE rate (PCI – CABG) Upper 1-sided 95% CI
Primary End Point of MACE 30 PCI CABG 25 Log-rank P=0.02 20 17.2% Cumulative Incidence, % 15 11.0% 10 5 0 0 1 2 3 4 5 Years Since Randomization No. at Risk PCI 464 425 385 328 267 148 CABG 401 378 295 230 125 343 Event rates were derived from Kaplan-Meier estimates