Introduction to Chemistry: The Way Science Works
230 likes | 330 Vues
Explore the study of matter composition, chemical and physical changes, with a focus on scientific laws, theories, variables, controls, and the scientific method. Learn about measurements, accuracy, precision, density calculations, temperature conversions, and organizing data through graphs and charts.

Introduction to Chemistry: The Way Science Works
E N D
Presentation Transcript
Introduction to Chemistry CHEMISTRY = the study of the composition of matter, its chemical and physical changes, and the changes that accompany these changes.
The Nature of Science • Scientific law versus theory: • Scientific law: a summary of an observed natural event. • Scientific theory: a well tested, possible explanation of a natural event.
The Way Science Works… • Science involves critical thinking, or applying logic and reason to observations and conclusions. • Observation vs. Inference • Observation: descriptive of what you see, hear, taste, feel, smell • Inference: an assumption made as a result of an observation (not always correct!!)
Variables and Controls • A variable is anything that can change in an experiment. • Independent variable: The variable being changed or controlled by the scientist. • Dependent variable: The variable being measured or observed by the scientist. • A controlled experiment tests only one variable at a time.
The Scientific Method:A series of logical steps to follow in order to solve problems. • OBSERVE • FORMULATE A QUESTION • FORM A HYPOTHESIS • DESIGN AND CONDUCT AN EXPERIMENT • MAKE OBSERVATIONS • RECORD AND ANALYZE DATA • DRAW CONCLUSIONS • FORMULATE NEW QUESTIONS and CONTINUE CYCLE
Making Measurements • Measurements are made in this class using SI units. • LENGTH (m): distance between 2 points • VOLUME (L): space occupied. • MASS (kg): the amount of matter in an object. • WEIGHT (N): the force with which gravity pulls on a quantity of matter.
Accuracy vs. Precision • Accuracy: the extent to which a measurement approaches the true value. • Precision: the degree of exactness of a measurement. • A scale may be precise to the nearest 100th of a gram, or +/-0.01g
Precision vs. Accuracy increasing precision increasing accuracy
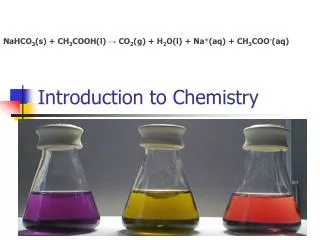
Density = mass/volume • Example: • What is the mass of 10 mL of a liquid that has a density of 3.76 g/mL? d = m / v m = dv m = (3.76 g/mL)(10 mL) m = 37.6 g m = 40 g (correct # of sig. figs.) M D V
Calculations • Calculate the density of each: • A can of Coke has a volume of 355 mL and a mass of 394 g (assuming that the weight of the aluminum can is constant) • A can of Diet Coke has a volume of 355 mL and a mass of 355.1 g (assuming that the weight of the aluminum can is constant)
WHY is Diet Coke less dense? • There is less mass in the same volume (355 mL) • Coke has 39 grams of sugar in it to sweeten it (355 + 39 = 394 g) • Diet Coke only needs 0.1 g of Nutra Sweet to make is just as sweet as Coke (355 + 0.1 = 355.1 g)
Temperature Conversions • Temperature is a measure of the average kinetic energy in a system. • K = Kelvin • oF = degree Fahrenheit • oC = degree Celsius • R=Rankin (we won’t use this one in this class)
Temperature Conversions • K = oC + 273 • oF = (1.8 x oC) + 32 • oC = (oF – 32) / 1.8
Percentage Error • Calculate this value in labs where the accepted value is given.
Organizing DataData is organized and presented in tables, charts, and graphs. GRAPHING... Graph - visual representation of data 1) title 2) x and y axis labeled 3) units for both the x and y axis 4) scale is evenly and correctly spaced for data 5) legend when appropriate
LINE GRAPH LINE GRAPH: best for displaying data that change. • Independent Variable: x-axis • Dependent variable: y-axis
BAR GRAPHS BAR GRAPH: useful when you want to compare data for several individual items
PIE CHARTS PIE CHART: ideal for displaying data that are parts of a whole.