Download

1 / 33
330 likes | 449 Vues
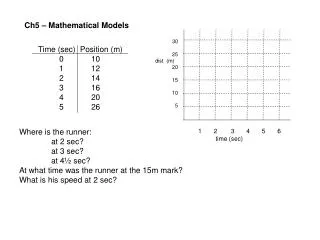
Main tendencies and mathematical models of energy problems. Contents: Consumption of primary sources and energy Production of primary energy sources Perspectives of energy demand growing Energy balance Price for energy How much energy does it need

E N D
Main tendencies and mathematical models of energy problems • Contents: • Consumption of primary sources and energy • Production of primary energy sources • Perspectives of energy demand growing • Energy balance • Price for energy • How much energy does it need • Nuclear Energy (reality and potential)
Primary energy resources consumption(global aspects) Growing of primary energy sources consumption in XX century. Population change in ХХ century.
Primary energy resources consumption in developed and in developing countries
Variants of energy consumption convergence Specific energy consumption change in developed and in developing countries in dependence on convergence scenarios. a – convergence on specific consumption of primary energy sources by 2016, b – convergence on specific consumption of primary energy sources by 2050.
Electricity and Heat (3800mtoe) Industrial &Household Transportation 1830 mtoe (4500 ) mtoe 3700 мtoe 2400 мtoe 2200 мtoe 1100 мtoe 690 мtoe 300 мtoe Biomass& waste Coal Gas Renewable Nuclear Oil Energy consumption structure
Annual production of hydrocarbons (assessment of production dynamics,peaking factor) Proved oil resources in different countries all over the world [Energy Information Administration(2006)]
Annual hydrocarbon production (assessment of production dynamics, peaking factor) Oil production in USA To determine parametersandGo Oil production in England
Energy export in goods form • Energy import in goods form • Primary energy sources consumption • Primary energy sources import • Primary energy sources production • Export of primary energy sources Energy exchange between countries Goods of primary production stage Goods of final consumption. Primary energy
Main equation of connection of GDP and energy Two kinds of goods: 1- low additional value (primary production stage – steel, aluminum, fertilizers, cement…) 2- goods of final consumption (cars, electronics, wear…) Interval solution for a lot of countries allows to determine K1 andK2 under conditions
EnergyBalance for Russia Oil, Gas, Coal 547 mil. toe Russia 1176 mil. toe World Al , steel, chemical fertilizersat all 210 mil. toe Total exports of energy(65%)
Energy saving Average rate of GDP energy efficiency growing 0.8% for 1% GDPannually
Auction model of price establishment Alone customer A lot of customers
Prognostic oil cost Prognoses of IEA
Prognostic calculation of primary energy resources production, population growth in different countries Data bases on production and consumption of primary energy resources, GDP, population of different countries all over the world Structural scheme of DES mathematical model Calculation of primary energy resources consumption, group of goods production taking into account restrictions for primary energy resources in GDP, GDP calculation 1)Prognosis of dynamic relation of К1/K2 2)Calculation of energy sources prices
Structure of Dynamic Energy System(DES) code Heat Elect Energy Water Thermal H2 Gas Coal Oil Hydro Nuclear Renewable Solar, Wind, Biogas Isotopes Fuel for transportation Base position DES code for the analysis of full energy system development.
How much energy does it takes 40-50 mlrd. toe
Nuclear energy(Necessary scale ) Close to maximum 2030 – 8% in fuel balance 2050 –10% in fuel balance
Tendency of energy consumption convergence Relation of average energy consumption in two groups