
(q/p) / ( σ q/p)
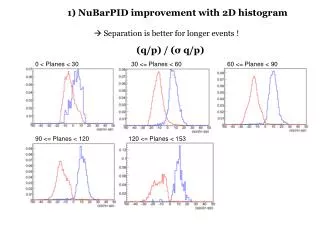
1) NuBarPID improvement with 2D histogram. Separation is better for longer events !. (q/p) / ( σ q/p). 0 < Planes < 30. 30 <= Planes < 60. 60 <= Planes < 90. 90 <= Planes < 120. 120 <= Planes < 153. So tried the following 2D PDFs for the NuBarPID

(q/p) / ( σ q/p)
E N D
Presentation Transcript
1) NuBarPID improvement with 2D histogram Separation is better for longer events ! (q/p) / (σ q/p) 0 < Planes < 30 30 <= Planes < 60 60 <= Planes < 90 90 <= Planes < 120 120 <= Planes < 153
So tried the following 2D PDFs for the NuBarPID (in addition to #planes, y, and dcosz) neutrinos antineutrinos Note: Every “row”, or slice of planes (for instance from 0 to 30) is normalized to unity, as seen in previous slide. This is to keep the effect of the #planes PDF separate (and not be E dependent)
nu nubar • A slight improvement is observed ! After Why two peaks for neutrinos? Purity Before After Efficiency
2) Effect of a cut on First Checked that subroutine used to determine whether a muon stopped or not in the detector is working. Looked at track end position: y (m) Things that stop x (m) z (m) y (m) Things that do not stop x (m) z (m)
In order to analyze performance of making a cut on stoppers, the following was done: • Use 4 NuBarPID with 4PDFs: 1) the 2D q/p/(σ q/p) vs. planes histogram 2) planes 3) y 4) cosz • The pdfs were made with no cuts required, except basic track quality ones: At least 1 track Trk.fit.pass==1 U-Vasym < 6 /ndf < 20 • Plots of Purity vs. Efficiency were made. The efficiency now includes all cuts (including the basic track quality ones, and the one). In other words, efficiency is measured with respect to all CC nubar events.
No extra cut x=1.0 x=0.5 x=0.3 x=0.15
Attempted Jeff H’s cut of Prob( , ndf) > 0.1. It works pretty good for high purity!!!! 3) Effect of other cuts No extra cut x=0.15 cut Prob(chi2,ndf)>0.1 cut Any other cuts to try?