Download
1 / 52
530 likes | 801 Vues
Lane Departures. By: Deborah S. McAvoy, M.S., P.E., PTOE Tapan K. Datta, Ph.D., P.E. Lane Departures. What are Lane Departures? Vehicles leaving their designated lane Crossing the Centerline Leaving the Roadway Where do Lane Departures Occur? Low Traffic Volumes High Travel Speeds

E N D
Lane Departures By: Deborah S. McAvoy, M.S., P.E., PTOE Tapan K. Datta, Ph.D., P.E.
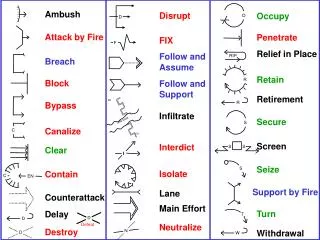
Lane Departures • What are Lane Departures? • Vehicles leaving their designated lane • Crossing the Centerline • Leaving the Roadway • Where do Lane Departures Occur? • Low Traffic Volumes • High Travel Speeds • Rural Highways and Roadways
Lane Departures • Why do Lane Departures Occur? • Distracted Driving • Driver Fatigue • Driver Drowsiness or Falling Asleep • Driving Under the Influence
Distracted Driving • National Highway Traffic Safety Administration (NHTSA) estimates 25% of all crashes involve driver distraction • Distracted Driving • Drivers concentrate on something other than operating their vehicles
Distracted Driving • Physical Distractions • Searching for music on the radio • Changing CD’s • Talking on a cell phone • Drinking/eating • Reading while driving • Talking to passengers/children
Distracted Driving • Cognitive Distractions • Gazing out the window • Wandering thoughts • Road Rage • Aggressive mood • Boredom • Fatigue
Drowsy/Fatigued Driving • NHTSA estimates falling asleep is responsible for : • 100,000 crashes per year • 40,000 injuries per year • 1,550 fatalities per year
Drowsy/Fatigued Driving • Characteristics • Late night/early morning or mid-afternoon crashes • Crash is likely to be serious • Involves a single vehicle leaving the roadway • Crash occurs on a high-speed roadway • The driver does not attempt to avoid the crash • The driver is alone
US-2 Road Safety Audit • Sponsored by OHSP • Conducted by Wayne State University-Transportation Research Group Summer of 2005 • Limited Scope • Crash Analysis
US-2 • One of two main east-west routes in the UP • Located along the northern shore of Lake Michigan • Highly Scenic Route • Passes through several recreational areas • High percentage of Recreational Vehicles and Commercial Trucks
US-2 Project US-2 Study Area, Crystal Falls to St. Ignace
US-2 Crash Analysis • Preliminary Crash Analysis • Detailed Crash Analysis of high-crash segments • Corridor Crash Analysis • High Deer Crash Locations • Speeding Related Crash Locations • Run-off-the-Road Crash Locations
US-2 Crash Analysis • Focus Segment Crash Location Map SV = Single Vehicle Crash HO = Head-on Crash RE = Rear-end Crash
US-2 Crash Trends • Yearly Crash Trends along US-2 (2001-2003)
Monthly Variation of Crashes along US-2 (2001-2003)
Time of Day Variation of Crashes along US-2 (2001-2003) Injury and Fatal Crashes Property Damage Only – Run-off-the-Road Crashes
Light Condition Variation of Crashes along US-2 (2001-2003) Injury and Fatal Crashes Property Damage Only – Run-off-the-Road Crashes
Road Condition Variation of Crashes along US-2 (2001-2003) Injury and Fatal Crashes Property Damage Only – Run-off-the-Road Crashes
Annual Trend of Crashes along US-2 (2001-2003) Involving Drivers Under the Influence of Alcohol (1999-2003) Speeding-Related Crashes (1999-2003)
Annual Trend of Crashes along US-2 (2001-2003) Involving Unbelted Drivers (1999-2003) Deer-Related Crashes (1999-2003)
Crash Causation along US-2 • Detailed analysis of the 848 fatal crashes, injury crashes and PDO-ROR crashes (2001-2003)
Lost Control Crashes • Icy, Snowy or Slushy Road Conditions • 191 Crashes • 71.5% • Wet Road Conditions • 41 Crashes • 15.4% • Dry Road Conditions • 33 Crashes • 12.4%
Lost Control Crashes • Icy, Snowy or Slushy Road Conditions • 163 Single Vehicle ROR Crashes • 7 Type A Injury • 12 Type B Injury • 28 Type C Injury • 9 Head-On ROR Crashes • 3 Fatal Crashes • 1 Type A Injury • 1 Type B Injury • 1 Type C Injury
Lost Control Crashes • Wet Road Conditions • 32 Single Vehicle ROR Crashes • 3 Type A Injury • 7 Type C Injury • 3 Head-On ROR Crashes • 2 Type A Injury
Lost Control Crashes • Dry Road Conditions • 25 Single Vehicle ROR Crashes • 3 Type A Injury • 3 Type B Injury • 2 Type C Injury • 5 Sideswipe Crashes • 1 Type A Injury • 1 Type C Injury • 2 Head-On ROR Crashes • 1 Fatal Crash • 1 Type C Injury
Failed to Yield Crashes • Icy, Snowy or Slushy Road Conditions • 7 Crashes • 4.7% • Wet Road Conditions • 29 Crashes • 19.5% • Dry Road Conditions • 113 Crashes • 75.8%
Failed to Yield Crashes • Icy, Snowy or Slushy Road Conditions • 5 Angle (2 ROR) • 2 Type A Injury • 2 Type C Injury • 1 Rear-End • 1 Type C Injury
Failed to Yield Crashes • Wet Road Conditions • 17 Angle Crashes (7 ROR) • 1 Fatal Crash (ROR) • 4 Type A Injury • 5 Type B Injury • 4 Type C Injury • 4 Head-On Crashes (1 ROR) • 2 Type B Injury • 1 Type C Injury • 4 Rear-End Crashes (1 ROR) • 2 Type B Injury • 1 Type C Injury
Failed to Yield Crashes • Dry Road Conditions • 72 Angle Crashes (22 ROR) • 4 Fatal Crashes • 15 Type A Injury • 13 Type B Injury • 33 Type C Injury • 12 Head-on Crashes (1 ROR) • 1 Type A Injury (ROR) • 2 Type B Injury • 6 Type C Injury • 9 Single Vehicle Crashes (6 ROR ) • 2 Type B Injury • 4 Type C Injury
Unable to Stop Crashes • Icy, Snowy or Slushy Road Conditions • 17 Crashes • 13.3% • Wet Road Conditions • 40 Crashes • 31.3% • Dry Road Conditions • 71 Crashes • 55.5%
Unable to Stop Crashes • Icy, Snowy or Slushy Road Conditions • 7 Rear-End Crashes (3 ROR) • 5 Type C Injury • 4 Angle Crashes (3 ROR) • 1 Type B Injury • 1 Type C Injury
Unable to Stop Crashes • Wet Road Conditions • 32 Rear-end Crashes (6 ROR) • 5 Type B Injury • 24 Type C Injury • 5 Angle Crashes (1 ROR) • 1 Fatal Crash (ROR) • 1 Type B Injury • 3 Type C Injury • 2 Single Vehicle ROR Crashes • 1 Type A Injury
Unable to Stop Crashes • Dry Road Conditions • 54 Rear-end Crashes (3 ROR) • 3 Type A • 8 Type B • 43 Type C • 6 Single Vehicle Crashes (5 ROR) • 1 Type B • 3 Type C
Driver Fell Asleep Crashes • Icy, Snowy or Slushy Road Conditions • 3 Crashes • 4.5% • Wet Road Conditions • 14 Crashes • 20.9% • Dry Road Conditions • 49 Crashes • 73.1%
Driver Fell Asleep Crashes • Icy, Snowy or Slushy Road Conditions • 2 Single Vehicle ROR Crashes • 2 Type B Injury • 1 Sideswipe ROR Crash • 1 Type A Injury
Driver Fell Asleep Crashes • Wet Road Conditions • 13 Single Vehicle ROR Crashes • 2 Type A Injury • 2 Type B Injury • 2 Type C Injury • 1 Head-on Crash • 1 Fatal Crash
Driver Fell Asleep Crashes • Dry Road Conditions • 42 Single Vehicle Crashes (41 ROR) • 4 Type A Injury • 9 Type B Injury • 7 Type C Injury • 3 Head-on ROR Crashes • 2 Fatal Crashes • 1 Type B Injury • 1 Sideswipe-Opposite ROR Crash – Fatal Crash • 1 Angle ROR Crash – Type B Injury • 1 Rear-end Crash – Type C Injury
Driver Fell Asleep Crashes • Time of Day Crash Occurred • 6 am – 9 am • 13 Crashes • 19.4% • 9 am – 3 pm • 23 Crashes • 34.3% • 3 pm – 7 pm • 8 Crashes • 11.9% • 7 pm – 6 am • 2 Crashes • 3.0%
Distracted Driver Crashes • Icy, Snowy or Slushy Road Conditions • 6 Crashes • 10.7% • Wet Road Conditions • 7 Crashes • 12.5% • Dry Road Conditions • 43 Crashes • 76.8%
Distracted Driver Crashes • Icy, Snowy or Slushy Road Conditions • 2 Sideswipe Crashes (1 ROR) • 1 Type B Injury (ROR) • 1 Single Vehicle ROR Crash – Type C Injury • 1 Rear-end Crash – Type A Injury
Distracted Driver Crashes • Wet Road Conditions • 2 Single Vehicle ROR Crashes – PDO • 2 Rear-end Crashes (1 ROR) • Type C Injury • 1 Head-on ROR Crash – Type A Injury • 1 Angle ROR Crash – Type C Injury
Distracted Driver Crashes • Dry Road Conditions • 17 Single Vehicle Crashes (15 ROR) • 4 Type B Injury • 4 Type C Injury • 17 Rear-End Crashes (5 ROR) • 4 Type A Injury • 3 Type B Injury • 8 Type C Injury • 2 Head-on ROR Crashes • 1 Type A Injury • 1 Type C Injury • 1 Sideswipe Opposite ROR Crash – Fatal Crash
Distracted Driver Crashes • Time of Day Crash Occurred • 6 am – 9 am • 3 Crashes • 5.4% • 9 am – 3 pm • 25 Crashes • 44.6% • 3 pm – 7 pm • 15 Crashes • 26.8% • 7 pm – 9 pm • 5 Crashes • 8.9% • 9 pm – 6 am • 2 Crashes • 3.6%
Crashes to Target for Reduction • Lost Control on Dry Road Conditions • Unable to Stop on Dry Road Conditions • Driver Fell Asleep • Driver was Distracted
Potential Crash Reductions • Total Crashes • 227 Crashes in three years or 75.67 per year • Fatal Crashes • 6 in three years or 2 per year • Type A Injury Crashes • 21 in three years or 7 per year • Type B Injury Crashes • 35 in three years or 11.67 per year • Type C Injury Crashes • 76 in three years or 25.33 per year
Combating Distracted Driving • Driving safety is challenging enough when full attention is paid to roadways • It takes one distracted second for a crash to occur • Recovery on dry road conditions in fair weather conditions is possible • Recovery on icy or wet road conditions in fair weather conditions is difficult • Recovery on icy or wet road conditions in poor weather conditions is nearly impossible
Combating Distracted Driving • Shifting driver’s focus back to driving • Improving recovery area for drivers