Download
1 / 22
220 likes | 334 Vues
GlobGlacier WP4 progress at SGEU Eero Rinne , s0794770@sms.ed.ac.uk University of Edinburgh School of GeoSciences Edinburgh Earth Observatory. Project work status (August 2008) . # Name of deliverable Date Status Phase 1:

E N D
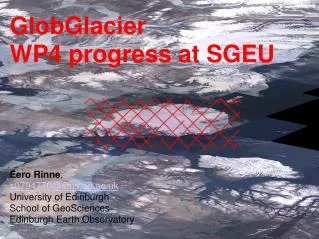
GlobGlacierWP4 progress at SGEU Eero Rinne, s0794770@sms.ed.ac.uk University of Edinburgh School of GeoSciences Edinburgh Earth Observatory
Project work status (August 2008) # Name of deliverable Date Status Phase 1: 1 Requirements Baseline KO + 3 Done 2 Design Justification File KO + 5 Done (almost) 3 Technical Specification KO + 9! To be written 4 Service Case Description KO + 9! To be written 5 Design Definition File KO + 9! To be written 6 Acceptance Test Document KO + 12 To be written 7 Product Validation Protocol KO + 13 To be written 8 Prototype Product Set (200 WP4 products) KO + 15 ~ 20/200 9 Preliminary Validation and Assessment Report KO + 15 To be written Phase 2: (not begun yet) 10 GlobGlacier products accord. to SCD (800 prod.) KO + 16-33 0/800 11 GlobGlacier System KO + 30 12 Promotional DVD KO + 32 13 Product Validation Report KO + 35 14 Integration Report KO + 35
Work Packet 4 – elevation change “Changes in glacier surface elevation will be obtained by differencing gridded DEMs from two epochs in time (e.g. InSAR, stereo-photogrammetry) and from time-series of satellite (and partly airborne) altimetry data (e.g. RADAR, LiDAR). Additionally, methods for spatial extrapolation of point measurements to the entire glacier surface will be developed.”
Work behind deliverables • Done so far: • Processing software for IceSat GLAS data → elevation change • Processing software for EnviSAT RA2 data → elevation change • Preliminary sensitivity and error analysisPoint elevation change and error assesment are the two information layersrequired to be in WP4 product laid down by SoW. • Todo: • Finalize and optimize GLAS and RA2 scripts • Test on real WP1 and GLIMS outlines in different places • InSAR DEM processing chain – work will begin in September and software will be ready at spring 2009 when free ASTER DEM:s are due • InSAR DEM:s are required for raster comparison elevation change product
IceSat GLAS 06 dataset • Laser altimeter data [1] • Global coverage: 86 N – 86 S • Density of ground tracks increases with latitude • Elevation [h] measurements of land areas • Laser altimeter with ~ 65 m footprint and 170 m spacing between measurements • Precision ~ 15-50 cm depending on the surface slope [2] • 15 observation periods so far • first: 20 Feb. to 21 Mar. 2003 • last so far: 17 Feb to 21 Mar 2008. • Available for free
GlobGlacier processing chain for IceSat data • Extract elevations for area of interest from GLAS06 global product (needs lat/lon box as input) • Read data into Matlab • Reproject if necessary • Find crossover points inside outline given by WP1 (accepts shapefile as input) • Average elevations inside 100-500 m radius of crossover points for each operation period (or interpolate elevation in exact crossover point) • Filter out bad data points: • 3-sigma clipping, too much temporal variation • Calculate trend and standard deviation for elevations at each crossover point • Output is surface elevation [m], elevation trend [m/a] and std. of elevation [m] and timespan [a] of measurements inside given outline
IceSat GLAS data challenges • IceSat is optimized for large ice sheets with very small or zero surface tilt • 91 day repeat orbit makes getting repeat measurement from same place scarce • Spatial averaging problematic due to surface tilt – elevation trend is very sensitive to averaging parameters • Using lower level data might provide better filtering tools but is really beyond scope of GlobGlacier • Nevertheless IceSat data has been used for studies of smaller ice bodies with complicated surface geometry – for example Malaspina Glacier, Alaska [3]
EnviSAT RA2 (radio altimeter) data • Radio altimeter ~ 10 km footprint • Data available since late 2002 to present • RA2 copes better with land ice surface elevation than RA1 did (that is, does not lose lock when retracking surface as easily). • Arctic land areas > 65N (similar dataset for Antarctic areas available later) • Elevation change (dH) at every orbital crossover point where ascending and descending track elevations agree • Processed from lower level data by UCL, London
GlobGlacier processing chain for RA2 data • Read data into Matlab • Reproject if necessary • Find crossover points inside outline given by WP1 • Filter out bad data points • 3-sigma clipping, too much temporal variation, something else? • Calculate trend and standard deviation for elevations at each crossover point • Output is surface elevation trend [m/a] and std. of elevation of RA2 orbital crossover points inside given outline [m] and measurement timespan [a]
Method development area – Devon Ice Cap • Relatively large ice cap (14000 km^2) relatively north (75 N) → multiple RA2 and GLAS orbital crossover points • Shape and flow is well documented and an airborne DEM is available [4] [5] • Elevation 0-2000 m. • ASIRAS radio altimeter data from CryoSAT validation experiment campaigns available (tools to process this have been made but data has not been yet used.) • Has areas with complicated geometry and a rather simple dome structure Nice picture of Devon here! Image: Devon Island from Landsat global mosaic (NASA)
Devon Ice Cap elevation trends from GLAS andRA2 (preliminary results)
Other work on Devon elevation change From Colgan et. al 2008 [6]: Elevation change of high altitude area of Devon from InSAR velocity, in situ stake and accumulation measurements – claiming elevation change to be near zero. Black lines are flight lines of NASA laser altimeter flights Abdlati et. al, 2004 [7].
To Be Solved • Need for better data filtering algorithm is apparent – one elevation outlier will mess up elevation trend • Should we use spatially averaged or extrapolated IceSat measurements? • How to combine RA2 data using different reference orbits? • How to tackle seasonal variation: • Guess magnitude and phase from other sources? • Fit a sinusoidal curve with 12 month wavelength? • Only use measurements made in certain time of year? • Forget about it? • On some glaciers (suitable orientation, too small for enough orbital crossovers) GLAS repeat track processing might be best solution. • Spatial extrapolation of point measurements to the entire glacier surface? • Easy enough if meteorological conditions and accumulation/drainage are constant over the whole glacier but for example Devon Ice Cap needs dividing into smaller areas. We need for additional information to do this!
DEM generation by InSAR [8] • SGUE has access to archive of ERS-1, ERS-2 and ASAR images suitable for DEM creation by InSAR processing • Output is a very high resolution (< 10 m x 10 m) high precision DEM • Usage of IceSAT GLAS measurements as control points will improve accuracy and allow DEM creation in areas with no or poor ground control points • InSAR DEM:s will be compared with other raster DEM:s (ASTER, airborne, other historic) resulting in elevation change raster • Creating DEM (registering data, error estimation, unwrapping etc.) is time consuming manual work.
Quick example of an InSAR DEM ERS1/2 tandem InSAR DEM. 95-96, NE Greenland (K. Briggs, SGUE)
Interaction with other WP's • WP1 • Ice cap and glacier outlines • If possible, outlines of basins and drainage areas? • WP3 • Need for ASTER DEM:s to compare with InSAR • We will provide DEM:s from InSAR as agreed • We want to pick a common test area to concentrate on in the first stage(one of the key regions of phase 1, probably) and agree when we have our DEM:s ready for comparison • WP5 • Velocity maps to distinguish subareas (drainage basins, ice flows) tosupport elevation change analysis • General • Agree on data format of raster DEM:s and point elevation change products
References [1] Zwally et al: ICESat's laser measurements of polar ice, atmosphere, ocean and land Journal of Geodynamics. Vol 34, 2002. [2] Brenner et al: Precision and Accuracy of Satellite Radar and Laser Altimeter Data Over the Continental Ice Sheets IEEE Transactions on geoscience and remote sensing, Vol. 45, No. 2, Feb 2005 [3] Sauber et at: Ice elevations and surface change on the Malaspina Glacier, Alaska Geophysical research letters, Vol 32, 2005 [4] Dowdeswell et al: Form and flow of the Devon Island Ice Cap, Canadian Arctic. Journal of geophysical research - earth surface Vol. 109 Issue: F2, April 2004. [5] Shepherd et al: Mass balance of Devon Ice Cap, Canadian Arctic. Annals of Glaciology vol. 46, 2007[6] Colgan et al: Is the high elevation region of Devon Ice Cap thickening? Journal of Glaciology, Vol 54, No. 186, 2008 [7] Abdlati et al: Elevation changes of ice caps in the Canadian Arctic Archipelago Journal of Geophysical Research, Vol 109, 2003 [8] Rosen et al: Synthetic aperture radar interferometry, IEEE Proceedings Vol. 88 Issue 3, 2000.