Download
1 / 85
860 likes | 999 Vues
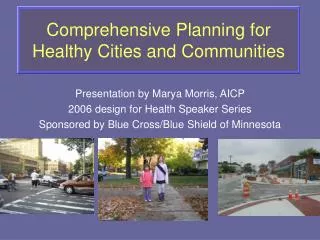
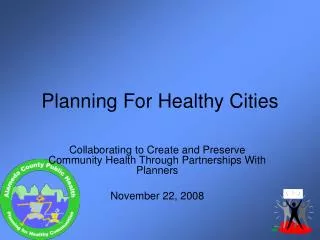
Planning For Healthy Cities. Collaborating to Create and Preserve Community Health Through Partnerships With Planners November 22, 2008. Outline. A Framework for Health Equity The built environment’s direct effects on health Asthma, obesity Alameda County data

E N D
Planning For Healthy Cities Collaborating to Create and Preserve Community Health Through Partnerships With Planners November 22, 2008
Outline • A Framework for Health Equity • The built environment’s direct effects on health • Asthma, obesity • Alameda County data • Housing, transportation, air quality, food access and liquor stores, physical activity and neighborhood conditions • What ACPHD is doing • ACPHD’s 3-pronged approach • Planning for Healthy Communities work groups, policy, Community Capacity Building (CCB)
Health Inequities Health inequities are “differences in health which are not only unnecessary and avoidable but, in addition, are considered unfair and unjust.” -Margaret Whitehead
What Do We Know? • Over the past 4 decades, the overall health outlook in Alameda County has improved. • However, health benefits have not been experienced equally in the county and across population subgroups. • In Alameda County, • health inequities are • observed by: • Place • Income • Race
Income Matters: Health Inequities by Neighborhood & Household Poverty
7.8 years 4.9 years 2.3 years Race and Racism Matters: Health Inequities by Race/Ethnicity
Infant mortality Mortality Life expectancy
Chronic disease Infectious disease Injury (intentional and unintentional) Disease and Injury Mortality Access to health care 10 – 15% Genetics 10 – 15%
Smoking Medical Model Nutrition Physical activity Risk Factors & Behaviors Disease and Injury Mortality Individual health knowledge 70% ?? Violence
No Data <10% 10%–14% Obesity Trends Among U.S. AdultsBRFSS, 1990 *BMI ≥30, or ~30 lbs overweight for 5’ 4” female
No Data <10% 10%–14% 15%–19% Obesity Trends Among U.S. AdultsBRFSS, 1994
No Data <10% 10%–14% 15%–19% ≥20 Obesity Trends Among U.S. AdultsBRFSS, 1997
No Data <10% 10%–14% 15%–19% ≥20 Obesity Trends Among U.S. AdultsBRFSS, 2000
Obesity Trends Among U.S. AdultsBRFSS, 2004 No Data <10% 10%–14% 15%–19% 20%–24% ≥25%
Obesity Trends Among U.S. AdultsBRFSS, 2007 <10% 10%–14% 15%–19% 20%–24% 25%-29% ≥30%
Prevalence of Overweight for Low-incomeChildren Aged < 5 Years19% Increase, 1992 - 2001 Overweight = BMI > 95th percentile. Overweight is comparable to obesity in adults. Source: California Dept. of Health Services, Children’s Medical Services Branch, California Pediatric Nutrition Surveillance System
Probability of Becoming Obese Adult if Obese at Obese Children Are Very Likely to Become Obese Adults Age 6 50% Age 13 70 – 80% Source: Am Fam Physician, 1999; U.S. Dept of Health and Human Services, 1996; Schoen C, Davis K, Collins KS, et al. The Commonwealth Fund Survey of the Health of Adolescent Girls, 1997.
Link Between Obesity and Type 2 Diabetes Colditz GA et al., Ann Intern Med 1995;122:481-486.
Is This All About Personal Responsibility? The Medical Model Assumes that “Risk Behaviors” are the Missing 70%
Community Trajectories HOW MUCH DOES PLACE MATTER?
Neighborhood Conditions • Physical • Social Residential segregation ? Social Inequities Risk Factors & Behaviors Disease and Injury Mortality Workplace Conditions
High school grads: 90% Unemployment: 4% Poverty: 7% Home ownership: 64% Non-White: 49%
High school grads: 81% Unemployment: 6% Poverty: 10% Home ownership: 52% Non-White: 59%
High school grads: 65% Unemployment: 12% Poverty: 25% Home ownership: 38% Non-White: 89%
Part Two: Social Inequities Health Inequities Segregation Income & Employment Education Housing Transportation Air Quality Food Access & Liquor Stores Physical Activity & Neighborhood Conditions Criminal Justice Access to Healthcare Social Relationships & Community Capacity Social Inequities
When the external becomes internal: How we internalize our environment Allostatic Load High Demand-Low Control Jobs Stress Inadequate TransportationLong Commutes Stress Lack of access to stores, jobs, services Stress Housing Stress Stress Lack of social capital Stress Crime
Schools Corporations and businesses Institutional Power Social Inequities Risk Factors & Behaviors Disease and Injury Mortality Government agencies
Race/ethnicity Class Gender Discriminatory Beliefs (Isms) Institutional Power Social Inequities Risk Factors & Behaviors Disease and Injury Mortality Immigration Status Disability Sexual Orientation
Results of the statistical comparison of weather and deaths over 12 years show that blacks and those with a high school education or less are most likely to die on extremely hot days. – Harvard School of Public Health study of almost 8 million deaths in 50 cities from 1989 to 2000.
“The heat wave was a particle accelerator for the city: It sped up and made visible the hazardous social conditions that are always present but difficult to perceive.” “ Yes, the weather was extreme. But the deep sources of the tragedy were the everyday disasters that the city tolerates, takes for granted, or has officially forgotten.”- Eric Klineberg, author of Heat Wave
Life and Death from Unnatural Causes:Health and Social Inequity in Alameda County
Report Chapters • Executive Summary • Introduction • Part One: Health Inequities • Part Two: Social Inequities • Social Inequities: Root Causes of Health Inequities • Segregation • Income & Employment • Education • Housing • Transportation • Air Quality • Food Access & Liquor Stores • Physical Activity & Neighborhood Conditions • Criminal Justice • Access to Health Care • Social Relationships & Community Capacity • Historical Overview • What Research Tells Us • A Look at Alameda County • Data to Action: Policy Implications