Download
1 / 33
330 likes | 517 Vues
Case Histories. Outlines Exploration geophysics incorporating 4 th dimension DC resistivity monitoring and 4D interpretation Spectral IP and 4D interpretation Case histories Case history 1: Dye tracer experiment Case history 2: Safety analysis of high-storied building

E N D
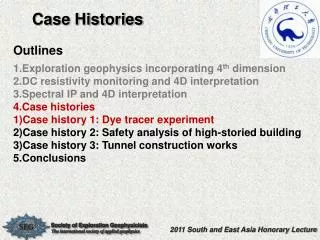
Case Histories • Outlines • Exploration geophysics incorporating 4th dimension • DC resistivity monitoring and 4D interpretation • Spectral IP and 4D interpretation • Case histories • Case history 1: Dye tracer experiment • Case history 2: Safety analysis of high-storied building • Case history 3: Tunnel construction works • Conclusions
4. Case histories 1: Dye tracer experiments Visualizing the infiltration pattern of dye solute Flooding dye tracer: Brilliant Blue FCF solution (0.09 S/m) monitoring before, during & after injection Excavating ground Extracting infiltration pattern Observing stained ground Comparing time-lapse images (Resistivity) Kim et al. (2009)
4. Case histories 1: Dye tracer experiments Data acquisition Pole-dipole array Measurement interval = 10 cm Dipole length = 20 cm
4. Case histories 1: Dye tracer experiments Data acquisition • Data acquisition system • SuperSting R8/IPTM (8 channels) • 108 automatic switch boxes • Statistics per one phase (3 tomographic sections) • Measurement time: 85 minutes • No. of data: 2,450
4. Case histories 1: Dye tracer experiments Processing & interpretation Time lapse mages Flooding zone
4. Case histories 1: Dye tracer experiments Processing & interpretation Stain images after monitoring completed
4. Case histories 1: Dye tracer experiments Processing & interpretation Stain images after monitoring completed Completely different each other. We have to calculate difference images
4. Case histories 1: Dye tracer experiments Processing & interpretation Flooding zone Green colored zone: similar to flooding zone; Noticeable change did not occur after the first flooding. Phase3/Phase2
4. Case histories 1: Dye tracer experiments Processing & interpretation Flooding zone Fully saturated by 1st flooding Phase3/Phase2
4. Case histories 1: Dye tracer experiments Processing & interpretation Flooding zone Fully saturated by 1st flooding Main event by 2nd flooding Phase3/Phase2
4. Case histories 1: Dye tracer experiments Processing & interpretation Flooding zone ① ③ Lateral flow ②
4. Case histories 1: Dye tracer experiments Processing & interpretation Flooding zone ① ③ Lateral flow ② • Stained image: only final result • Geophysical monitoring: reconstructing history of earth change • Precisely knowing the past and present, then what remains? Predicting and forecasting the future
Outlines • Exploration geophysics incorporating 4th dimension • DC resistivity monitoring and 4D interpretation • Spectral IP and 4D interpretation • Case histories • Case history 1: Dye tracer experiments • Case history 2: Safety analysis of high-storied building • Case history 3: Tunnel construction works • Conclusions
4. Case histories 2:Safety analysis of high-storied building Safety analysis Background Abandoned old mine Kim et al. (2007) • Geology and hydrogeology • Geophysics • 3. Rock engineering Direction of mining tunnel Hyundai Hometown Apartment Complex
4. Case histories 2:Safety analysis of high-storied building Geophysics - Well logging - Borehole radar reflection - Crosshole resistivity tomography: 2-D and 3-D Too conductive to apply radar technique
4. Case histories 2:Safety analysis of high-storied building Geophysics - Well logging - Borehole radar reflection - Crosshole resistivity tomography: 2-D and 3-D Thin graphite layers along foliation planes of the basement rock Strong anisotropy of resistivity
4. Case histories 2:Safety analysis of high-storied building < 10 ohm-m Strong anisotropy > 30 ohm-m (water, air) Perfect Isotropy Crosshole resistivity tomography 1. Delineating subsurface cavities Basement Higher resistivity Cavities Lower anistropy
4. Case histories 2:Safety analysis of high-storied building Anisotropy ratio Crosshole resistivity tomography 1. Delineating subsurface cavities Anisotropy ratio Resistivity 72-76m Mining tunnel A location simultaneously showing high resistivity and low anisotropy
4. Case histories 2:Safety analysis of high-storied building Safety analysis 2. Providing subsurface model for the safety analysis Subsurface Model Setup Geology + Logging (geology, geophysics, rock engineering) + Tomography images Continuum model (FLAC)
4. Case histories 2:Safety analysis of high-storied building Safety analysis Rock mechanics data Safe Continuum model 2-D(FLAC) 3-D(FLAC3D) Input Model Underground /building • Before construction • After construction • Effect of groundwater Safety analysis Discontinuum Model UDEC
Outlines • Exploration geophysics incorporating 4th dimension • DC resistivity monitoring and 4D interpretation • Spectral IP and 4D interpretation • Case histories • Case history 1: Dye tracer experiments • Case history 2: Safety analysis of high-storied building • Case history 3: Tunnel construction works • Conclusions
4. Case histories 3: Tunnel construction works Background & field works • Tunneling changes ground condition? • Resistivity monitoring detect changes? • Reliability and accuracy of estimated changes? • What information? • Tunnel depth: 40-100 m • Tunnel size: 9x20 m • Lines along tunnels: 4 • Lines cross tunnels: 3 • Measurement spacing: 20 m Tunnel 1 Tunnel 2 Kim et al. (2010)
4. Case histories 3: Tunnel construction works Background & field works • Monitoring history • No. of time lapses: 6 • Monitoring period • 25 Feb 2007 – 31 Jan 2008 T6 T5 T4 Tunnel 1 Tunnel 2 Significant changes X
4. Case histories 3: Tunnel construction works Results & interpretation T4 LN-3 - Comparison of interpretation methods (difference images) No construction works under monitoring area (T2, T3, T4) T2/T1 T3/T1 T4/T1
4. Case histories 3: Tunnel construction works Results & interpretation T6 T5 T4 LN-3 - Comparison of interpretation methods (difference images) Construction works under monitoring area (T5, T6) T5/T1 T6/T1 Which one is true?
4. Case histories 3: Tunnel construction works Results & interpretation Changes along parallel line LN-2 T2/T1 T3/T1 T4/T1 T5/T1 T6/T1 ??
4. Case histories 3: Tunnel construction works Results & interpretation T6-T5 CR-3 CR-2 CR-1 Lines across vs. along tunnel
4. Case histories 3: Tunnel construction works Results & interpretation In-tunnel cement grouting T6-T5 Line 2 Line 3
Conclusions Conclusions • Able to incorporate non-spatial parameters as new coordinates or dimensions (4D, 5D, …) through multi-dimensional, multi-parametric and multi-mode approaches • Inversion/processing in the extended domains dramatically increases precision and accuracy • Having conceptual mechanisms, we are able to introduce them into the processing/inversion in the newly established data and/or model domains • Hopefully, boundaries among many geophysical methods fade away • Further, geophysics + hydrogeology + geochmistry + …. • Why not, other sciences ?
謝謝! 감사합니다! Thank You ! Acknowledgements • Society of Exploration Geophysicists • Shell Sponsorship • Chengdu University of Technology • Korea Institute of Geoscience and Mineral Resources • Ministry of Science and Technology, Korea • HeesongGeotek, Co., Ltd. • Hyundai Construction Co. and other Construction companies in South Korea 2011 South and East Asia Honorary Lecture
謝謝! 감사합니다! Thank You ! My special thanks to • Mr. Robert Supper, Geological Survey of Austria • Prof. Eung-Je Woo, Impedance Imaging Research Center, Kyung Hee University, Korea • Prof. PanagiotisTsourlos, Aristotle University of Thessaloniki, Greece • Prof. Yutaka Sasaki, Kyushu University, Japan • My colleagues, Geoelectric Imaging Lab., KIGAM 2011 South and East Asia Honorary Lecture
Join Today! SEG Membership • Technical Journals in Print and Online • Networking Opportunities • Receive Membership Discounts on: • Continuing Education Courses • Publications • Workshops and Meetings Free Bookmark SEG materials are available today! Join Online http://seg.org/join 2011 South and East Asia Honorary Lecture
Student Opportunities • Student Chapters available • Student Chapter Book Program • SEG/Chevron Student Leadership Symposium • Challenge Bowl • Student Membership Resources • Scholarships • SEG/ExxonMobil Student Education Program • Annual Meeting Travel Grants • Student Expos • the Anomaly newsletter More information please visit: http://seg.org/students 2011 South and East Asia Honorary Lecture