Effective Software Development Planning: A Comprehensive Approach
In this lecture, students learn the critical importance of careful planning in software engineering. Key planning elements include assigning planned hours and values to tasks, tracking earned value, and maintaining an organized workload. Students explore techniques for breaking tasks into manageable units, using various planning forms to enhance coordination within teams, and ensuring that project estimates are accurate. Additionally, the lecture covers the TSPi planning process, supporting tools, and the tracking of work progress, making it integral for successful software project execution.

Effective Software Development Planning: A Comprehensive Approach
E N D
Presentation Transcript
Software Engineering Process II Development Plan INFO 637 Glenn Booker Lecture #4
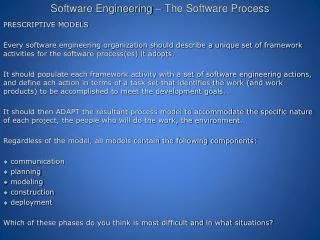
Need to Plan • We need to plan our effort carefully, to help ensure that: • Everyone knows what to do and when • We know if we’re going off schedule • We can improve the accuracy of our predictions • Detailed planning helps make some of our inaccuracies counterbalance each other • Results in more accurate overall estimates Lecture #4
Plan(ned) Hours • Each task is assigned a planned number of hours for its completion (Plan Hours), based on the estimation methods discussed in the PSP • The sum of Plan Hours for all tasks is the total effort needed for the project, in staff-hours (Total Plan Hours) Lecture #4
Plan Value • Each task is also assigned a Plan Value (PV), which is the percent of the project’s value assigned to completing that task • The sum of Plan Value for all tasks in the project is, by definition, 100% • If all tasks are equal significance by effort, PV = (Plan Hours) * 100 / (Total Plan Hours) Lecture #4
Earned Value • As tasks are completely finished, they earn Earned Value (EV) in the amount of their Plan Value • Hence at any time, the total EV earned is the sum of PV for all tasks which have been completed Lecture #4
How Detailed to Plan? • Tasks should be broken down to under ten hours per person per task • For a full project, you generally don’t want to micromanage to tasks under a work-day, because then you’ll spend more time planning than working Lecture #4
Where Record Tasks? • The overall project, and small programming tasks, can be planned on a SUMP form • Unplanned tasks (including startup for the project) can be identified as M&M (Management and Miscellaneous) tasks • M&M is typically 5-10% of the first cycle • Quality plans go on a SUMQ form Lecture #4
Software Estimates • Use the same techniques used for the PSP • Sizes of parts and assemblies, ranging from smallest to largest, are called: • Modules (assemblies of objects) • Components (assemblies of modules) • Products (assemblies of components) • System (assemblies of products) Lecture #4
TSPi Planning Process • Conceptual design was created in the strategy phase • Initial estimates of parts for each cycle were also developed in the strategy phase (STRAT form) Lecture #4
TSPi Planning Process • Now use SUMS form to list the components to be developed in the first cycle • Also on the SUMS form, identify test plans and requirements specifications which apply to these components Lecture #4
TSPi Planning Process • Use TASK and SCHEDULE forms to identify how long each component will take to create • Include time for individual effort each week, and team effort as well • Blend to provide TASK and SCHEDULE for entire team • Calculate PV and expected completion date for each task Lecture #4
TSPi Planning Process • Make the quality plan, using SUMQ form (discussed later) • Copy TASK and SCHEDULE for each person • Personalize these by deleting tasks others will perform • Determine PV and estimated completion for each personal task Lecture #4
TSPi Planning Process • Review the TASK and SCHEDULE forms for each person, and balance the workload • Adjust tasks and responsibilities as needed to make the schedule fair to everyone • Use the adjusted individual plans to regenerate the overall team TASK and SCHEDULE, plus the SUMP and SUMQ • Give these to all team members and instructor Lecture #4
TSPi Support Tool • The TSPi Support Tool can be used to help support this process, but it doesn’t fully automate the process • If not using the Tool, most teams discuss and balance their workload before committing it to the forms, to avoid revising the individual plans, and then regenerating the team plans Lecture #4
Development Plan Script PLAN1 p. 75 • Based on the conceptual design • Identify specific products to be produced, and estimate their sizes • Record STRAT data in SUMS • Produce task plan using TASK form • Produce team’s schedule plan using SCHEDULE form, including expected weekly hours per person Lecture #4
Development Plan Script PLAN1 • Produce the quality plan using estimated SUMP and SUMQ plans • Break out individual plans based on the team TASK and SCHEDULE plans • Balance workload, then reconsolidate the team TASK and SCHEDULE plans • Send TASK, SCHEDULE, SUMS, SUMP, and SUMQ to team members and instructor Lecture #4
Tracking Work • Record your time in the time recording log (LOGT) • This helps update your personal TASK and SCHEDULE forms • When a task is completed, enter the week in the TASK form • This will feed the Earned Value for that week Lecture #4
Tracking Work • At the end of each work week, generate the updated TASK and SCHEDULE to show the time and EV status of your work • Enter these on the WEEK form, and give to your planning manager • Enter defects on the defect recording log (LOGD) • These feed the SUMP form for each assembly Lecture #4
Tracking Work • Note that inspection defects (INS) do not automatically show up; the product owner needs to enter each inspection defect on form LOGD as well • Once a component has been developed, enter its size in SUMS for that part • Includes documentation size, not just code Lecture #4
Tracking Work • Update SUMP to track the time, size, and defect data for each engineer • A separate SUMP should be maintained for each assembly, and each phase • Generate the SUMQ form for each assembly, with time, size, and defect data • Generate team level TASK & SCHEDULE, and assembly-level SUMP and SUMQ Lecture #4
Tracking Work • Each person reports to the team weekly using the WEEK script; and the team reports to the instructor using the same form Lecture #4
Quality Plan • The quality plan (SUMQ) is outlined on pages 88-89 • It is a summary of the quality results for the project to date, comparing the quality goals with the actual results as they become available • Description of each SUMQ section follows Lecture #4
Quality Plan • Summary section has the overall team productivity (LOC/hour), and the percent of reuse and new reuse (if any) • Percent Defect-Free (PDF) section describes the percent of components which had no defects, by life cycle phase • Defects/page describes documentation quality Lecture #4
Quality Plan • Defects/KLOC describes the total number of defects which were found during development • Defect Ratios compare the defect rates for different activities • Development time ratios (%) compare the amount of time spent in phases to their review activities Lecture #4
Quality Plan • A/FR is the Appraisal to Failure Ratio; the ratio of time spent in reviews and inspections to the time spent in failure detection activities (compile, test) • Want A/FR > 2 for small programs, >1 if large • Review Rates and Inspection Rates measure how fast reviews and inspections are performed Lecture #4
Quality Plan • Defect injection and removal rates (Defects/Hr.) measure how quickly defects were made and discovered during each life cycle phase or inspection • Phase Yield is the percent of defects entering the phase which were removed • Process Yield is the percent of defects removed before entering a phase Lecture #4
Quality Plan • The quality plan is heavily dependent on having sound data input • Hence the data recorded for every task and every defect must be as accurate as possible, or the final results will quickly become gibberish! Lecture #4