INVENTORY PLANNING & MANAGEMENT - WEBINAR
441 likes | 1.84k Vues
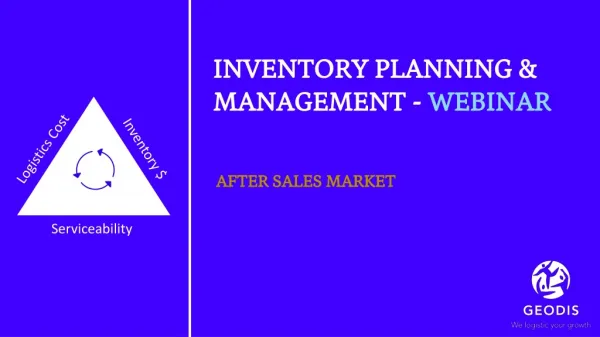
INVENTORY PLANNING & MANAGEMENT - WEBINAR. Logistics Cost. Inventory $. AFTER SALES MARKET. Serviceability. Technical Support. Please submit your questions for the Q&A Session in the question box. Please mute your mic. INVENTORY OPTIMIZATION – AFTER SALES. Welcome!.

INVENTORY PLANNING & MANAGEMENT - WEBINAR
E N D
Presentation Transcript
INVENTORY PLANNING & MANAGEMENT - WEBINAR Logistics Cost Inventory $ AFTER SALES MARKET Serviceability
Technical Support Please submit your questions for the Q&A Session in the question box Please mute your mic INVENTORY OPTIMIZATION – AFTER SALES
Welcome! Adam Walker (Singapore) Key Accounts Director GEODIS Supply Chain Optimization adam.walker@geodis.com. Madhusudan Shankar (Singapore) Head of Business Solutions GEODIS Supply Chain Optimization madhusudan.shankar@geodis.com FOLLOW US: /geodis-supply-chain-optimization /GEODIS_SCO
LET’S START! Logistics Cost Inventory $ Serviceability
Broader Benefits of Inventory Optimization INVENTORY OPTIMIZATION – AFTER SALES
The After sales inventory optimization challenge INVENTORY OPTIMIZATION – AFTER SALES
What is Inventory Planning & Management ? Process, Methodology, Tools and Management System needed to achieve a right balance between Inventory Value, Serviceability and Logistics Cost Logistics Cost Inventory $ It is just not about Stocking Strategy or Inventory Value… Serviceability INVENTORY OPTIMIZATION – AFTER SALES
Are we making enough progress? NOT ENOUGH!! Even in Big Data & Predictive analytics world ?? Source: SupplychainBreif , Supply Chain Shaman Journal http://www.supplychainshaman.com/demand/five-reasons-why-are-we-not-making-progress-on-inventory-management/ INVENTORY OPTIMIZATION – AFTER SALES
Issues hindering the progress? Planning Methodology: No holistic view of supply chain while performing inventory planning (often de-centralized at plant or warehouse level) Impacting elements: Lack of understanding of all direct / in-direct elements impacting inventory planning & serviceability ERP function: Standardized ERP functions not enough customization (Inventory modules) to business needs Stocking Strategy: Technical gap in defining optimal stocking strategy at various levels of distribution system INVENTORY OPTIMIZATION – AFTER SALES
Why it is critical in after sales market ? Increased Demand Variability Long & complex Supply Chain Service level expectation (More than ever ) Significant revenue & often highly profitable stream Short life cycle products Rising cost of capital INVENTORY OPTIMIZATION – AFTER SALES
11 How GEODIS could help overcome challenges Using, IP&M, Package of METHODOLOGY, PROCESSandTOOL Professionals with decades of service logistics industry experience Based on Multi-Echelon inventory planning methodology Capable of performing STRATEGIC PLANNING & EXECUTION PLANNING INVENTORY OPTIMIZATION – AFTER SALES
GEODIS’ answer INVENTORY OPTIMIZATION – AFTER SALES
How GEODIS could help overcome challenges Using GEODIS Inventory Planning & Management System (IP&M System) what to, how much to, and where to stock inventory Webinar Focus INVENTORY OPTIMIZATION – AFTER SALES
What to optimize ? Inventory category reminder Focus of webinar Cycle Stock Stock planned to use during a given period Ex: between production cycles Safety Stock Stock to manage demand & lead time uncertainties In-Transit / WIP S.S Inventory in transit and is inaccessible Pre-build Stock Stock needed when a demand for a given period exceeds capacity INVENTORY OPTIMIZATION – AFTER SALES
Where to put inventories ? Multi-Echelon supply chain explanation HOLISTIC VIEW OF SUPPLYCHAIN • Considers all levels & all inventories within an organisation • Deeper insight into challenges from Top to Bottom • Addresses issues at each stage • Defines relationship between various stages of the supply chain. Ex: Supply & Demand fluctuation INVENTORY OPTIMIZATION – AFTER SALES
Multi-Echelon vs Single Echelon Supplier Manufacturing DC (Global / Regional) Country DC FSL Customer NETWORK LEVEL PLANNING SINGLE ECHELON MULTI - ECHELON INDEPENDENT PLANNING Inventory Planning – @ Network level Inventory target – @ Network level Service level objective - Global Inventory Planning – Independent @ Echelon level Inventory target – Independent @ Echelon level Service level objective - Local INVENTORY OPTIMIZATION – AFTER SALES
What? Howmuch? Where? – GEODIS Methodology Stocking level calculation @ levels of distribution system (Multi-Echelon) Understanding of sources of Demand Collection of Inputs & Constraints 2 5 3 1 4 Demand Categorization of SKU Stocking Strategy Scenario Builders INVENTORY OPTIMIZATION – AFTER SALES
Understanding Sources of Demand 1 2 3 4 5 Impact Safety Stock Level Fulfillment Source decision Planned Maintenance Y Y Unplanned Repairs / Emergency Y Y Parts for specific Projects N Y Parts for Sales N Y INVENTORY OPTIMIZATION – AFTER SALES
Demand Categorization of SKU More Variable 1 2 3 4 5 Less Variable Non- Intermittent Intermittent INVENTORY OPTIMIZATION – AFTER SALES
Demand Categorization of SKU 1 2 3 4 5 Why we do ? • Critical to understand Demand behavior of SKU to customize safety stock calculations • Each Demand Category should be applied with appropriate distribution model (Ex: Normal, Gamma, Negative Binomial) • Safety stock calculation differs between distribution models • Stocking level decisions at various echelons is based on Demand Category INVENTORY OPTIMIZATION – AFTER SALES
Stocking Strategy – Key Inputs and Constraints 1 2 3 4 5 Serviceability Parts Cost Demand Category Vitality of Part Supply Lead Time How vital a material for the machine / equipment? % of order fulfillment P.O Creation Manufacturing Transportation Clearance Inventorization Purchase cost of material Smooth, Erratic Lumpy, Slow Input for Positioning & Stocking level Input for Stocking level calculation Input for Positioning Decision INVENTORY OPTIMIZATION – AFTER SALES
Stocking Strategy – Scenario Builders SAMPLE 1 2 3 4 5 Option-2 Dimensions Option-1 Dimensions Input Dimensions Demand Category 4 4 C Part Cost 3 3 Supply Lead Time 2 2 C Vitality as Independent Factor C 4 0 Vitality Code 24 96 Scenarios Build to Decide the Stocking Strategy Customizable C INVENTORY OPTIMIZATION – AFTER SALES
Stockinglevelcalculation 1 2 3 4 5 Customer Customer Customer Customer FSL / Distributor FSL / Distributor Country DC Plant / OEM Global / Regional DC Safety Stock Coverage INVENTORY OPTIMIZATION – AFTER SALES
Inventory Planning & Optimization Tools Supply Chain Guru Geo IMS Developer Strategic Planning Strategic Planning Execution Planning Scope Area of Application After-sales market Sales market (Finished products) INVENTORY OPTIMIZATION – AFTER SALES
Business case - 1 INVENTORY OPTIMIZATION – AFTER SALES
Business Case 1 : Inventory Optimization Asia Pacific Customer Metrics Locations APAC Multi-Echelon Planning Segment &Product Industrial Product Spare Parts (After Market) Key Facts &Figures Monthly Volume 10K+ Orderlines p.m Countries 10 SKUs 9000+ Advisory Services Inventory Health Analysis Stocking & replenishment strategy recommendation Inventory Planning management system DC & FSL 02 & 30 M/F & OEMs 2 m/f & multiple OEMs INVENTORY OPTIMIZATION – AFTER SALES
Business Case 1 : Inventory Optimization Oursolution Challenges • Inventory Health Check • Mapping current Inventory planning & replenishment process • Defining TO-BE inventory planning & replenishment process • Stocking strategy recommendation using Multi-Echelon concept • Implement To-Be management system High back order rates despite of high inventory value Low order fulfillment rate Lack of management system Lack of standardized replenishment / rebalancing processes in the network INVENTORY OPTIMIZATION – AFTER SALES
Business Case 1 : Inventory Optimization CustomerBenefits ValueCreation Holistic view of current inventory situation Access to Inventory planning best practices & methodology To-Be process & Management system implementation and monitoring 26% reduction in Safety Stock 20 points serviceability improvement Significant reduction in inventory carrying cost due to new stocking strategy INVENTORY OPTIMIZATION – AFTER SALES
Broader Benefits Business Case -1 INVENTORY OPTIMIZATION – AFTER SALES
Business case - 2 INVENTORY OPTIMIZATION – AFTER SALES
Business Case 2 : Inventory Optimization China CustomerMetrics Locations China Segment &Product HIGH TECH Spare Parts Key Facts &Figures Assets NA Countries 1 Shipment NA Advisory Services Network Re-engineering & Optimization Inventory Health Analysis Stocking Level & Replenishment Planning Inventory Rebalancing Warehouses 04 Lead Time < 24 hours INVENTORY OPTIMIZATION – AFTER SALES
Business Case 2 : Inventory Optimization China Customerchallenges Oursolution • Assess Current network performance to understand the capacity • Network Design study to enhance on-time Order fulfilment rate • Setup Inventory helpdesk to improve replenishment program • Setup Inventory rebalancing program between China & the US • Low In-Time order fulfilment rate (33%) • Challenging service level < 24 hours • Customer base spread across China INVENTORY OPTIMIZATION – AFTER SALES
Business Case 2 : Inventory Optimization China ValueCreation CustomerBenefits Recognized Inventory reduction opportunity worth 11% of stock value Improved In-Time order fulfilment rates. 33% to 78% Trade-off analysis to help customer decision making process on additional FSL setup Achieve Cost Reduction Goal Order Fulfilment Bottleneck Identified which was Inventory positioning issue Clear mapping of current situation and simulation of potential scenarios INVENTORY OPTIMIZATION – AFTER SALES
Broader Benefits Business Case -2 INVENTORY OPTIMIZATION – AFTER SALES
Q & A Session INVENTORY OPTIMIZATION – AFTER SALES
Thank you! Adam Walker (Singapore) Key Accounts Director GEODIS Supply Chain Optimization adam.walker@geodis.com. Madhusudan Shankar (Singapore) Head of Business Solutions GEODIS Supply Chain Optimization madhusudan.shankar@geodis.com FOLLOW US: /geodis-supply-chain-optimization /GEODIS_SCO