Download
1 / 13
130 likes | 142 Vues
Get insights into the trends and updated data on class sizes in NYC, based on November 2016 reports. Discover the long-term changes and variations across grades and boroughs.

E N D
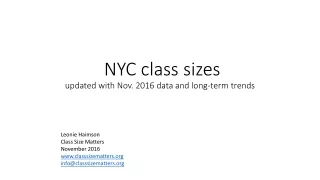
The trend in NYC class sizesupdated with Nov. 2016 data and long-term trends Leonie Haimson Class Size Matters June 2017 www.classsizematters.org info@classsizematters.org
A note on data sources: DOE class size reports • All class size data is posted on DOE website from 2006 -2017 at http://schools.nyc.gov/AboutUs/schools/data/classsize/classsize.htm • We use DOE November reports for each year based on the October 30 register, except for 2006 and 2007 for which the November report no longer available. • The November reports are a more accurate picture of what students experience for the first few months of school, because many students have dropped out by January, especially in high school. • In general we believe the high school data is unreliable, because the faulty DOE reporting process causes many high schools to falsely report ICT (inclusion) classes or classes with ELL students as two separate classes. • These class size averages include data for general education classes, ICT (inclusion classes) and gifted classes, but not self-contained special education classes capped at smaller sizes by state law. • For years before 2006-7 when the DOE started publicly reporting class size, we employ data from the NYC Independent Budget Office which received it directly from DOE.
In Nov. 2016, class sizes changed relatively little from the previous year, according to DOE, ranging from a decrease of .5 student per class in Kindergarten to an increase of .1 student per class in grade 8. Source: DOE Nov. 2016 class size summary posted at http://tinyurl.com/zpjguya
Class sizes in K-3 are larger than they were in 1999-2000LT trend class size K-3 1998-2016 Data sources: Independent Budget Office & NYC DOE
Class sizes in grades 4-8 are larger than in 2004-5LT trend class size grades 4-8 Data sources: Independent Budget Office & NYC DOE
Queens & Staten Island have largest class sizes on average(Nov. 2016 DOE data)