Download
1 / 11
110 likes | 233 Vues
Learn how to measure an electromagnetic field using an iron core solenoid and compass deflection. Understand the principle of deflection measurements and how to estimate the strength of the unknown magnetic field using the given equation. Follow the step-by-step demonstration and conduct measurements using the provided test apparatus. Plot your data on a graph, calculate an exponential regression curve, and determine the correlation coefficient for your data points.

E N D
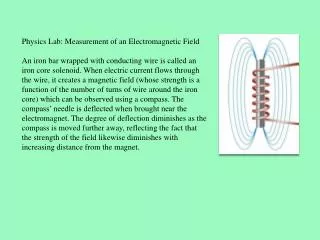
Physics Lab: Measurement of an Electromagnetic Field An iron bar wrapped with conducting wire is called an iron core solenoid. When electric current flows through the wire, it creates a magnetic field (whose strength is a function of the number of turns of wire around the iron core) which can be observed using a compass. The compass’ needle is deflected when brought near the electromagnet. The degree of deflection diminishes as the compass is moved further away, reflecting the fact that the strength of the field likewise diminishes with increasing distance from the magnet.
Since the earth’s magnetic field is aligned north and south, the addition of another magnetic field oriented in some other direction causes deflection of the compass needle away from north. Therefore, the degree of deflection is the net of the two magnetic forces. If deflection measurements are made in a magnetic field whose orientation is perpendicular to the earth’s field, the strength of the unknown field can be estimated by the following equation: B magnet = tan Ө B earth Where: Ө = angle of deflection from north, and Bearth = 5x10‒5Teslas. This principle is demonstrated as follows:
5.0 x 10‒5 T Tan Ө = B magnet - 5.0 x 10‒5 T B magnet = (5.0 x 10‒5 T)(tan Ө) compass needle Ө Ө B magnet
Test Apparatus for Measurement of an electromagnetic Field Power Supply Electromagnet / Iron Core Solenoid Ruler
Measure compass needle deflection in degrees from North at a number of distances from the magnet. The readings here are: 800 at 4.0 cm.
Record your data in this portion of the worksheet and perform the calculations indicated.
Plot your data on the graph: Distance in meters on the x-axis and magnetic field in Teslas on the y-axis. Connect the points that you plot with as smooth a line as you can draw.
Use your TI calculator to create a STAT table: Enter the distance data in L1, and the magnetic field data in L2.
Plot these data in the graph function. The data points should outline a curve that decreases exponentially.
Use the calculator to determine an exponentialregression curve for the data points, and write this equation in the appropriate area of the worksheet. Also determine the correlation coefficient R for your plot. This value indicates how well your data points fit the calculated curve.