Download
1 / 32
320 likes | 448 Vues
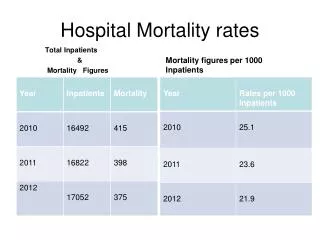
ScotPHO Training Day Hospital Standardised Mortality Ratios. Richard Dobbie Gavin MacColl (ISD Quality Improvement Programme). Routine Linked Data. Quality Strategy – Patient Centred. Clinical Engagement. Quality Improvement Programme. Hospital Standardised Mortality Ratios (HSMR’s)

E N D
ScotPHO Training DayHospital Standardised Mortality Ratios Richard Dobbie Gavin MacColl (ISD Quality Improvement Programme) better information --> better decisions --> better health
Routine Linked Data Quality Strategy – Patient Centred Clinical Engagement Quality Improvement Programme • Hospital Standardised Mortality Ratios (HSMR’s) • Surgical / Medical Profiles • Scottish Arthroplasty Project • Complaints • Incident Reporting Pilot • ‘Better Together’ Inpatient Survey • National Audits • SICSAG / Stroke / STAG-Sepsis / Renal Registry
Observed Deaths HSMR = Predicted Deaths S Observed Deaths = Deaths S Predicted Deaths = Predicted Probabilities What is an HSMR? better information --> better decisions --> better health
Data source - SMR01/GRO linked data Outcome - 30 day mortality Patient indexing – Quarterly (CIS) Explanatory variables • Age, sex, deprivation • Type of admission (elective / non-elective) • Inpatient / day case • Place admitted from • Number of previous emergency admissions • Primary diagnosis • Prior morbidity – 1 and 5 years • Surgical / non-surgical specialty HSMR Methodology better information --> better decisions --> better health
Profiles HSMR’s SAP Patient Record Sets better information --> better decisions --> better health
Primary Diagnostic Groupings better information --> better decisions --> better health
Prior Morbidity better information --> better decisions --> better health
Scottish Case-Mix Model(selected pathways in model) better information --> better decisions --> better health
Timeline of HSMR Development better information --> better decisions --> better health
Timeline of HSMR Development better information --> better decisions --> better health
Quarterly Release better information --> better decisions --> better health
Quarterly Release better information --> better decisions --> better health
Quarterly Release Baseline better information --> better decisions --> better health
Jan – Mar 09 Apr – Jun 09 Jul – Sep 09 Oct – Dec 09 9 Months Jul – Sep 10 Oct – Dec 10 Jan – Mar 11 Apr – Jun 11 4 Months 3 Months Addressing Timeliness better information --> better decisions --> better health
Timetable better information --> better decisions --> better health
What is a High HSMR? • A high HSMR where variation greater than +3SDs above Scotland HSMR • Also where HSMR >Scot HSMR but within control limits; Where HSMR is increasing or is steady over time • Distribution of variation shown on a funnel plot • In addition to published data, HSMR used as part of an internal process to highlight hospitals with exceptional variation (variation outwith norm) • Data variability on a funnel plot is not published – risk ofleague tables • Escalation protocol for potential quality/safety concerns flagged up by data – instigated by QIS (HIS) and ISD better information --> better decisions --> better health
HSMR Funnel Plot Control Limits Upper & Lower Scot HSMR CL+3SD Hospitals HSMR Unusual HSMR above CL(+3SD) CL+2SD CL-2SD CL-3SD better information --> better decisions --> better health
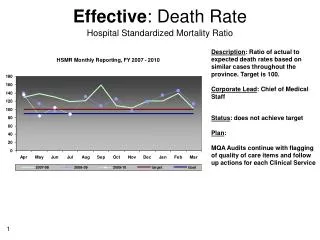
Information Support to Boards 1 • Provide data to support further investigation into high HSMR • HSMR trend over time and control limits better information --> better decisions --> better health
Information Support to Boards 2HSMR within control limits over time HSMR within Control limits Scot HSMR better information --> better decisions --> better health
Information Support to Boards 2 HSMR reaching control limits Unusual HSMR above CL(+3SD) Scot HSMR better information --> better decisions --> better health
Information Support to Boards 2 • Provide data to support further investigation into high HSMR • HSMR trend over time and control limits • HSMR stratified : Elective / non elective admissions, age group, specialty, diagnostic grouping better information --> better decisions --> better health
Information Support to Boards 2 • Elective / non elective, age group, specialty, diagnostic grouping • Example HSMR elective / non elective, age group, specialty, diagnostic grouping better information --> better decisions --> better health
Information Support to Boards 2 • Elective / non elective, age group, specialty, diagnostic grouping • Indicator of where to start to look • Indicate where Scot HSMR < lower 95% CI HSMR HSMR Scot HSMR better information --> better decisions --> better health
Deaths 30-Day Survivors Information Support to Boards 3 Case Listing better information --> better decisions --> better health
Unlikeliest Death According to Model Unlikeliest Survivor According to Model Information Support to Boards 3 Case Listing better information --> better decisions --> better health
Information Support to Boards 3 Value of Case Listing • Review of the patient journey • Review of clinical records • ICD 10 coding vs SMR01 linked file • HSMR catalyst for improvement(s) in SMR01 coding accuracy better information --> better decisions --> better health
Three funnel plots Effect of Coding better information --> better decisions --> better health
Regression – Scotland, Crosshouse The 15% ‘Target’ better information --> better decisions --> better health
Issues • Importance of Robust Clinical Coding • Individual probabilities of death based on ICD-10 coding • Supporting Users • Developing data pack (case listings, aggregations etc) • Working (proactively with stakeholders locally to avoid surprises • Main contacts (Patient Safety Leads, Clinical Governance) • Refer to existing resources (Navigator, Surgical / Medical Profile, ACaDMe) • Data Timeliness • SMR01 and GRO data submissions • 30-day Follow-up • Reduced lag better information --> better decisions --> better health
Thank you very much for listening If you would like to contact us: Richard Dobbie Richard.Dobbie@nhs.net Gavin MacColl Gavin.Maccoll@nhs.net Website address: www.isdscotland.org
Any Questions? better information --> better decisions --> better health