Download
1 / 79
800 likes | 991 Vues
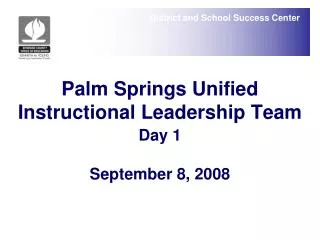
Palm Springs Unified Instructional Leadership Team Day 1 September 8, 2008. Core Materials Intervention & Time Teacher Training Principal Training Data. Coaching Collaboration Pacing Fiscal Support. 9 Essential Program Components. EL. Data. Student Achievement HS Graduation

E N D
Palm Springs UnifiedInstructional Leadership TeamDay 1September 8, 2008
Core Materials Intervention & Time Teacher Training Principal Training Data Coaching Collaboration Pacing Fiscal Support 9 Essential Program Components
EL Data Student Achievement HS Graduation Corrective Action F Intervention
DAIT Instructional Leadership Team • Day 1: Collaboration and Data Analysis • Day 2: English Language Focus • Day 3: Tier 1 Intervention
Professional Learning Community Six Characteristics • Shared Mission, Vision, and Values • Collective Inquiry • Collaborative Teams • Action Orientation and Experimentation • Continuous Improvement • Results Orientation
No Excuses University • Culture of Universal Achievement • Exceptional Systems • School Wide University Focus
Professional Learning Communities/ Exceptional Systems Data Analysis ILT Articulation CurriculumAlignment
Board, Superintendent, and District Administrators Principal Coach Team Leader Team Leader Team Leader Team Leader Team Leader Team Leader Member Member Member Member Member
Need for a Collaborative Culture “Through a ten-year study, whenever we found an effective school or an effective department within a school, without exception that school or department has been a part of a collaborative professional learning community.” --Milbrey McLaughlin Stanford University
What is Collaboration? A systematic process in which we work together, interdependently, to analyze and impact professional practice in order to improve our individual and collective results.
90% of the teachers of any particular school must demonstrate full implementation of any agreed upon strategy in order to produce significant results. Doug Reeves (2006)
Essential Outcomes of a Collaborative Team • Norms • Data Analysis • Protocol • 1 SMART Goal around one standard • 3 SMART Goals (Reading, Writing, Math) • Determine best practices • Essential Standards • Common Assessments • Pyramid of Interventions • Results
All Standards Key Standards CST Blueprint Essential SMART Goals Standards
Essential Standards • Reading • Writing • Math • 18-20 Standards total for the year • 6 per trimester • 3 per 6 week SMART goal rotation
Choosing Essential Standards • It is an essential life skill • It is essential to be successful in the next grade • It is essential to be successful in school • It is identified as essential on blueprints • We struggled with this standard last year • Failure on this standard is one of the reasons why we continue to perform lower on the CST strand • Entry level assessments identify this standard as an area of need • Our team wants to invest collaborative time on this standard
Monitor Essential Standards • Collaboratively plan how you will monitor the standards throughout the year • Introduce, Practice, Mastery • Student Efficacy • Align to pacing guide • SMART goal vs. Continue best practices and monitor
5% Tier 3 15% Tier 2 80% Tier 1 Intervention (Classroom)
The Data Team Process • Identify an essential standard (SMART Goal standard) • Develop a pre/post team generated common assessment-Approximately 5 questions • Organize student data • Identify target students • Identify strengths and obstacles on the pre-test by examining student work • Set a SMART goal • Identify strategies and results indicators • Implement strategies and monitor • Give post assessment • Determine effectiveness of strategies
Data Binders • Suggested content: • District & School Goals Grade Level SMART Goal record • Schedule of Meetings • Team norms • Standards • Blueprints • Research-based strategies • Common Assessments • CST and/or CAHSEE Released Items • ELD Standards
Frequency of Data Team Meetings Varies: Every 4-6 Weeks + Alternative Meetings Schools that realize the greatest shift to a data culture tend to schedule meetings at least twice per month
Alternative Team Meetings Those meetings that will NOT involve the study of new data • Plan and adjust focus strategies • Examine the rigor of SMART Goal standards • Alignment of Curriculum to Standards • Deepen Norms • Create common assessments that come between benchmarks • Calibrate administration and scoring of student assessment
Alternate Team Meeting # 1 • Select your essential standard • Analyze the testing blueprints and released items • Develop a grade level common assessment
Obstacles to Effective Collaboration • Weak Norms • Interesting People • Poor Understanding of Group Dynamics • Individualized Culture • Balkanized Culture • Contrived Collegiality • Poor Monitoring • Ineffective Data Analysis Systems • Compartmentalization of Programs and Systems • Lack of Meeting Protocol • Coaching resisted
Norms of High Performing Teams • Willingness to consider matters from another’s perspective • Accurate understanding of spoken and unspoken feelings and concerns of team members • Willingness to confront a team member who violates norms • Communicating positive regard, caring, and respect • Willingness and ability to evaluate the team’s own effectiveness • Seeking feedback about and evidence of team effectiveness from internal and external sources • Maintaining a positive outlook and attitude • Proactive Problem-solving • Awareness of how the group contributes to the purpose and goals of the larger organization Emotional Intelligence in the Workplace, Goleman
Seven Norms of Collaboration • Pausing • Paraphrasing • Probing for specificity • Putting ideas on the table • Paying attention to self and others • Presuming positive intentions • Pursuing a balance between advocacy and inquiry
Monopolizers Challengers The Victim Complainers Intimidators Noah, the Prophet of Doom Agreeable Arthur The Rescuer Controllers Know it alls The Slanderer Saboteur The Bully Charmer Manipulator Demanding A Few Examples ofInteresting People
Johari Window Known by self Unknown by self Known by others Open/Free Area Blind Area Unknown by others Hidden area Unknown area
Group Dynamics • Forming • Norming • Storming • Performing
Four Types of Team Cultures Individualistic Lone Ranger Teaching Balkanized Deep-rooted Cliques dividualistic Contrived Collegiality Cotton Candy Co. Collaborative Use data to improve practice
TRAINING EFFECTIVENESS The degree of proficiency attained in knowledge, skills, and application TRAINING OUTCOMES L M/H VL + L/M VL H + H H VL + H H H Very Low (VL) = 5% Low (L) = 10% Middle (M) = 40% High = 80%
Macro to Micro • Examine CST Data • Connect to Core Curriculum • Connect to rigor of the standard • Connect to Data Analysis Protocol
Leadership and Learning Matrix Lucky High results, low understanding of antecedents Replication of success unlikely Leading High results, high understanding of antecedents Replication of success likely Effects/Results Data Learning Low results, high understanding of antecedents Replication of mistakes unlikely Losing Low results, low understanding of antecedents D’oh! Antecedents/Cause Data Reeves, 2003
Connect to Data % of ____ students scoring at proficiency or higher in English Language Arts will increase from ___% to ___% by the end of 2008-2009 as measured by the CA Standards Test administered in April/May, 2009. Our third grade team will accomplish this goal by targeting our SMART goals around Reading Comprehension and English learners.
Connect to Data % of ____ students scoring at proficiency or higher in Mathematics will increase from ___% to ___% by the end of 2008-2009 as measured by the CA Standards Test administered in April/May, 2009. Our third grade team will accomplish this goal by targeting our SMART Goals using the results from entry level assessments and focusing on English learners.
An Example • Our team’s lowest area on CST was Algebra and Functions • On our math pretest, our students struggled on computation with whole numbers • Our first math topics are number sense • Numeration • Adding whole numbers • Subtraction number sense • Subtracting whole numbers to solve problems • Multiplication meanings and facts • On the CST Blueprint- 4 Questions on CST for 2.1 Find the sum or difference of two whole numbers between 0 and 10,000.
Develop a Team Common Assessment • Assessments from instructional programs • Release test questions • Inspect questions • Validity, Reliability and Practicality • Examine rigor from CST Released Items 5 questions per standard Keep it simple!
Released Test Questions 22 Look at the number sentence below. 67 + = 121 , Which number will make the number sentence true? A 54 B 56 C 64 D 68 21 9000 −3782 = A 5218 B 5328 C 6782 D 12,782
Release Test Questions 23 Which number is 6 more than 1026? A 1022 B 1032 C 1122 D 1132 24 The town of Milburg has 5256 grown-ups and 2987 children. How many people live in Milburg? A 7133 B 8133 C 8243 D 8343 25 502 −273 A 229 B 239 C 371 D 775
Administer Pre-test • Ensure common administration procedures • Agree upon cut scores • Proficient 5 correct • Almost got it: 4 correct • Far to go 2-3 correct • Missed the boat 0-1 correct
5-Step Data Analysis • Step 1: Collect Data • Step 2: Analyze Strengths and Obstacles • Step 3: Set SMART Goals • Step 4: Brainstorm Instructional Strategies • Step 5: Identify Results Indicators