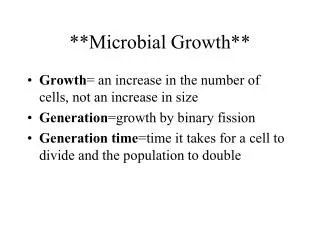
Microbial Growth
Microbial Growth. Unit 2. Figure 02: The Phylogenetic Tree of Bacteria and Archaea. Figure T01: Some major differences between Bacteria , Archaea , and Eukarya. Figure 05A: Variation in Shape and Cell Arrangements Single, pairs streptobacillus (chain). Courtesy of Jeffrey Pommerville.

Microbial Growth
E N D
Presentation Transcript
Microbial Growth Unit 2
Figure T01: Some major differences between Bacteria, Archaea, and Eukarya
Figure 05A: Variation in Shape and Cell Arrangements Single, pairs streptobacillus (chain) Courtesy of Jeffrey Pommerville
Figure 05B: Variation in Shape and Cell Arrangements Single, pairs streptobacillus (chain) Courtesy of Jeffrey Pommerville
Figure 05C: Variation in Shape and Cell Arrangements Single, pairs streptobacillus (chain) Courtesy of Jeffrey Pommerville
Figure 05C: Variation in Shape and Cell Arrangements Single, pairs streptobacillus (chain) Courtesy of Jeffrey Pommerville
Figure 09B: Bacterial Flagella. Flagellum of gram-neg bacterium
Figure 11B: The Spirochete Endoflagella. Spirochete endoflagellum
Figure 14AB: A Comparison of the Cell Walls of Gram-Positive and Gram-Negative Bacteria
Figure 14C: A Comparison of the Cell Walls of Gram-Positive and Gram-Negative Bacteria
Figure T02: A comparison of gram-positive and gram-negative cell walls.
Figure T03A: A summary of the structural features of prokaryotic cells
Figure T03B: A summary of the structural features of prokaryotic cells
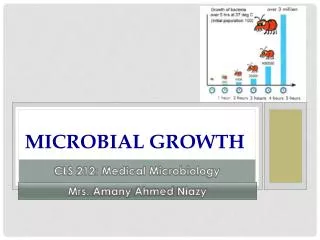
Figure T01: Microbial record holders Source: http://www.astrobio.net/news/
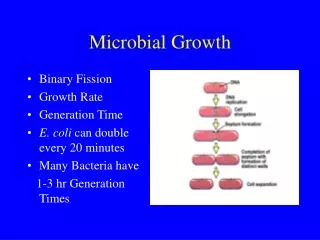
Figure 02A: The Process of Binary Fission. Binary Fisson of Bacteria.
Figure 05A: Bacterial colony on blood agar Courtesy of Dr. J. J. Farmer/CDC
Figure 07: The Formation of a Bacterial Spore by Bacillus subtilis.
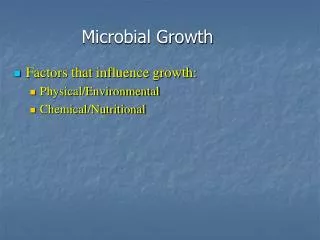
Figure 08: Growth Rates for Different Microorganisms in Response to Temperature.
Figure 09AB: Bacterial Cultivation in Different Gas Environments
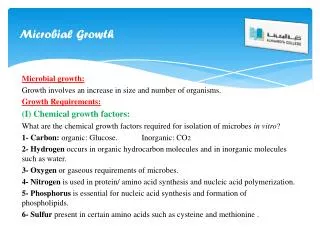
Figure T02: Composition of Complex & Chemically defined growth medium.