Download
1 / 75
750 likes | 1.04k Vues
Chapter 6. Applying Population Dynamics: The Human Population and Its Impact. Chapter Overview Questions. What is the history of human population growth, and how many people are likely to be here by 2050 ? How is population size affected by birth, death, fertility, and migration rates ?

E N D
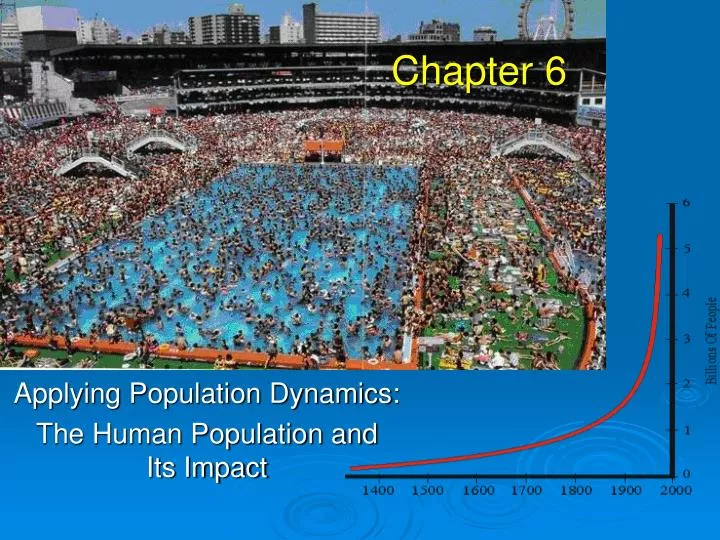
Chapter 6 Applying Population Dynamics: The Human Population and Its Impact
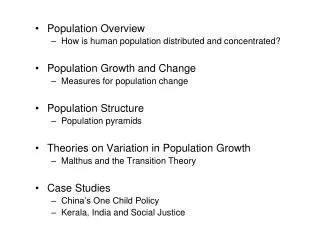
Chapter Overview Questions • What is the history of human population growth, and how many people are likely to be here by 2050? • How is population size affected by birth, death, fertility, and migration rates? • How is population size affected by percentages of males and females at each age level?
Chapter Overview Questions (cont’d) • How can we slow population growth? • What success have India and China had in slowing population growth? • What are the major impacts of human activities on the world’s natural ecosystems?
Core Case Study: Is the World Overpopulated? • The world’s population is projected to increase from 7 billion to about 9.5 billion between 2011 and 2050. • The debate over interactions among population growth, economic growth, politics, and moral beliefs is one of the most important and controversial issues in environmental science.
Core Case Study: Is the World Overpopulated? • Much of the world’s population growth occurs in developing countries like China and India. India 18% China 22% China + India = 40% USA is #3 with 4.5%
Core Case Study: Is the World Overpopulated? • Some argue that the planet has too many people. • Some feel that the world can support billions of more people due to technological advances. • There is a constant debate over the need to reduce population growth. • Must consider moral, religious, and personal freedom.
Two Fundamental Questions… WHY are living conditions so radically different between developed countries and undeveloped countries? “Accidents of Geography”…read Jared Diamond’s Guns, Germs, & Steel” WHY are population dynamics so different between developed countries and undeveloped countries? 3 Revolutions, Expansion into new ecosystems, and The Demographic Transition
More on this later…. The Demographic Transition Stage 1 Preindustrial Stage 2 Transitional Stage 4 Postindustrial Stage 3 Industrial High Birth rate Relative population size Birth rate and death rate (number per 1,00 per year) Death rate Total population Low Low Negative Increasing Zero Low Very high Decreasing Growth rate over time
HUMAN POPULATION GROWTH:A BRIEF HISTORY • The human population has grown rapidly because of • the expansion of agricultureand industrial production • expansion into new ecosystems • lower death rates from improvements in hygiene and medicine. 3 Revolutions! Agricultural Industrial-Medical Info-Globalization
Agricultural Revolution Before…
Agricultural Revolution After… (but before the “green revolution”)
Agricultural Revolution After…. (and after the “green revolution”)
Industrial-Medical Revolution Before…
Industrial-Medical Revolution Before…
GLOBAL HUMAN POPULATION GROWTH • 10,000 years ago 5 million • 1800 1 billion • 1930 2 billion • 1960 3 billion • 1974 4 billion • 1987 5 billion • 1999 6 billion • 2011 7 billion Currently: Still increasing, but at a decreasing rate. (Birth rates are still higher than death rates, but by a lesser and lesser amount)
GLOBAL HUMAN POPULATION GROWTH:A BRIEF HISTORY In 2008: • Still growing exponentially at 1.22% = • 82 million people added/yr = • 225,000 per day = • 2.4 people every time your heart beats!
Where Are We Headed? • We do not know how long we can continue increasing the earth’s carrying capacity for humans. • There are likely to be between 7.8-10.7 billion people on earth by 2050 (mean probability of 9.5 billion). • 97% of growth will be in developing countries among people living in acute poverty. Which leads to the question…
Where Are We Headed? • What is the optimumsustainable population of the earth based on the cultural carrying capacity? Thomas Malthus- 1796- Proposed that human populations will crash because agricultural production increases linearly, while population increases exponentially. So far, Malthus was “wrong”, because he did not forsee the exponential increase in food supply due to genetic & technical advances in agriculture.
Where Are We Headed? • U.N. world population projection based on women having an average of 2.5 (high), 2.0 (medium), or 1.5 (low) children. (Total Fertility Rate) Next
Total Fertility Rate High (2.5) High 10.7 Medium (2.0) Low (1.5) Medium 9.3 Population (billions) Low 7.8 Year Fig. 9-2, p. 173
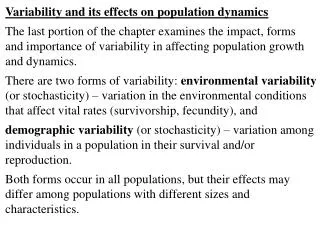
FACTORS AFFECTING HUMAN POPULATION SIZE • Population increases because of births and immigration and decreases through deaths and emigration. • Instead of using raw numbers, crude birth rates and crude death rates are used (based on total number of births or deaths per 1,000 people in a population).
1 Average crude birth rate Average crude death rate 21 20 World 9 8 2011? All developed countries 11 10 All developing countries 23 Why? 8 Developing countries (w/o China) 27 9 2006 data Fig. 9-3, p. 174
36 38 Africa 12 15 Latin and Central America 18 21 6 6 18 20 Asia 7 7 Oceania 18 17 2011? 7 7 United States 13 14 8 8 North America 14 13 8 8 11 Europe 10 11 11 2006 data Fig. 9-3, p. 174
Declining Fertility Rates: Fewer Babies per Women • Fertility is the number of babies one woman has in her lifetime.
Declining Fertility Rates: Fewer Babies per Women • Total Fertility Rate (TFR) is the average number of babies born per woman, per region.
Declining Total Fertility Rates: Fewer Babies per Women • The average number of children that a woman bears has dropped sharply. • This decline is not low enough to stabilize the world’s population in the near future. • Replacement-level fertility a.k.a. “ZPG”: the number of children an average couple must bear to replace themselves. • Total fertility rate (TFR): the average number of children a woman has during her reproductive years (average per region) What should global TFR be in order to achieve ZPG?
Declining Fertility Rates: Fewer Babies per Women • The replacement level TFR to sustain a population (attain ZPG) is : • 2.1 children in the developed world • 2.5 children in the developing world (why?) • In 2008, the average global Total Fertility Rate was 2.6 children per woman. • 1.6 in developed countries (down from 2.5 in 1950). • 2.8 in developing countries (down from 6.5 in 1950).
Case Study: Fertility and Birth Rates in the United States • 1900 - 76 million 2011 – 312 million • Nearly 2.9 million people were added to the U.S. in 2008: • 66% occurred because of births outnumbering deaths. • 34% came from illegal and legal immigration.
Case Study: Fertility and Birth Rates in the United States • In 2008, the total fertility rate in the United States was 2.1 Next
U.S. Total Fertility Rate Births per woman Replacement Level Baby boom (1946–64) Year Fig. 9-5, p. 175
Case Study: Fertility and Birth Rates in the United States • The baby bust that followed the baby boom was largely due to delayed marriage, contraception, and abortion. Next
U.S. Crude Birth Rate 1910 to 2010 End of World War II Births per thousand population Demographic transition: Transitional Stage to Industrial Stage Depression Baby boom Echo baby boom Baby bust Year Does this graph represent a stock concept or a flow concept? Fig. 9-6, p. 175
The Times, They are a Changin’ • In 1905, in the US: • The 3 leading causes of death were pneumonia, tuberculosis, & diarrhea • 90% of doctors had no college education • 1/5 of adults could not read or write • Average $ was 22 cents / hour, $200-400 / year • A total of 9000 cars • A total of 144 miles of paved roads • A 3 min. call from Denver to NYC cost $11 • The population of Las Vegas was 30 people • Most women washed their hair once a month
47 years Life expectancy 77 years 8% Married women working outside the home 81% 15% High school graduates 83% 10% Homes with flush toilets 98% 2% Homes with electricity 99% 10% Living in suburbs Key 52% 1900 Hourly manufacturing job wage (adjusted for inflation) $3 2000 $15 (USA) 1.2 Homicides per 100,000 people 5.8 Fig. 9-7, p. 176
Factors Affecting Birth Rates and Fertility Rates Direction of influence? • The number of children women have is affected by: • The cost of raising and educating them. • Availability of pensions. • Urbanization. • Education and employment opportunities. • Infant deaths. • Marriage age. • Availability of contraception and abortion.
Factors Affecting Death Rates • Death rates have declined because of: • Increased food supplies, better nutrition. • Improved sanitation and personal hygiene. • Safer water supplies. • Advances in medicine.
Factors Affecting Death Rates • U.S. infant mortality is twice that of any other industialized nation (ranked 46th world-wide) due to: • Inadequate pre- and post-natal care for poor women & children • Drug addiction. • High teenage birth rate.
Case Study: U.S. Immigration • Since 1820, the U.S. has admitted almost twice as many immigrants and refugees as all other countries combined. Next
1907 1914 New laws restrict Immigration Number of legal immigrants (thousands) Great Depression Year Fig. 9-8, p. 178
POPULATION AGE STRUCTURE • The number of people in young, middle, and older age groups determines how fast populations grow or decline.
POPULATION AGE STRUCTURE • The number of people younger than age 15 is a major factor determining a country’s population growth. • “Perhaps the world’s most important population statistic: 28% of the world’s population (in 2008) was under 15 years old.” • Developed countries: 17% • Developing countries: 30% (41% in Africa) • 1.9 billion about to enter their reproductive years! • In parts of Asia, Africa, & South America, 20-50% of the 15-24 age group is unemployed. What are the implications of this statistic for terrorism?
POPULATION AGE STRUCTURE • A population with a large proportion of its people in the preproductive ages 1-14 has a large potential for rapid population growth. Next
Age Structure Diagrams Male Female Female Male Female Male Male Female Expanding Rapidly Guatemala Nigeria Saudi Arabia Expanding Slowly United States Australia Canada Declining Germany Bulgaria Italy Stable Spain Portugal Greece Reproductive ages 15–44 Postreproductive ages 45–85+ Prereproductive ages 0–14 Fig. 9-9, p. 179
US Census Bureau Data Year 2000 Census 2009 US Life Expectancy At Birth: Male 75 yrs Female 82 yrs 2011: 80 yrs Fig. 9-11, p. 180
POPULATION AGE STRUCTURE • About 30% of the people in developing countries were under 15 years old in 2008 • versus only 17% in developed countries. Next
Developed Countries Male Female Age Population (millions) Fig. 9-10a, p. 179
Developing Countries Male Female Age Population (millions) Fig. 9-10b, p. 179
POPULATION AGE STRUCTURE • Today, baby boomers make up nearly half of all adult Americans and dominate the populations demand for goods and services. Next