Advanced Metabolite Profiling via GC-MS and UHPLC-MS Techniques in Dry Tissue Analysis
This study explores the comprehensive analysis of polar and lipophilic metabolites in dry tissue samples through advanced methods including GC-MS and UHPLC-MS. Derivatization is performed using different solvent systems, followed by metabolite deconvolution and identification via AMDIS and spectral matching with both commercial and custom libraries. Techniques like solid-phase extraction and NMR are integrated for enhanced metabolomics profiling, achieving detailed coverage of biomolecules such as flavones and saponins, contributing valuable insights into biochemical pathways.

Advanced Metabolite Profiling via GC-MS and UHPLC-MS Techniques in Dry Tissue Analysis
E N D
Presentation Transcript
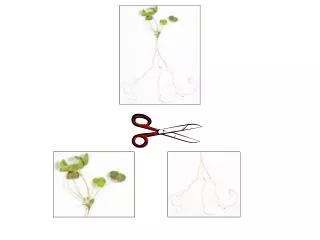
10 mg Dry Tissue MeOH +H2O & CHCl3 H2O/MeOH/CHCl3 H2O/MeOH CHCl3 Polar Lipophilic GCMS derivatization
POLAR Profile LIPOPHILIC Profile GCMS deconvolution and metabolite identification are performed using AMDIS and spectral matching with commercial & custom EI GC-MS Libraries UHPLC-MS deconvolution using Bruker Dissect, Waters MarkerLynx, and Agilent Mass Hunter. Metabolite identification via spectral matching with Custom (-)ESI UHPLC-MS & MS/MS Libraries of Authentic Compounds.
UHPLC-UV-MS-SPE-NMR Bruker/Spark Holland Prospeckt 2 Solid Phase Extraction Mass Spectrometer Make-up Pump 1.5 ml/min H20 UHPLC Analytical Column 0.560 ml/min UV waste 600 MHz NMR With Cryoprobe
UHPLC-UV-MS-SPE-NMR Bruker/Spark Holland Prospeckt 2 Solid Phase Extraction Make-up Pump 1.5 ml/min H20 UHPLC Mass Spectrometer Analytical Column 0.560 ml/min UV waste 600 MHz NMR With Cryoprobe
UHPLC-MS-SPE-NMR Bruker Maxis Qtof-MS/MS MS & SPE Splitter Gilson liquid handler For SPE eluant collection Dr. Dennis Fine Waters AcquityIClass UHPLC With photodiode array detector Prospect 2 Solid Phase Extraction Unit w/ 2 x 96 cartridges & deuterated solvent elution
LC/QTOF SPE Profile of Flavone/Saponin Mix Reference Spectrum of authentic umbelliferone ~900 ngUmbelliferone1H NMR
Current M. truncatula Metabolome Coverage Profiled Level#1 IDS* Shoot GCMS Polar 300 136 Shoot GC-MS nonpolar 250 112 GC-MS Shoot waxes 200 48 Volatile SPME-GCMS 150 74 UHPLC-QTofMS 200 75 Hormones GCMS/LC-QqQMS 25 25 = 1125 Total peaks profiled = 470 Total Peaks Profiled *IDs based upon co-characterization with authentic standards and per Sumner et al, 2007. Proposed minimum reporting standards for chemical analysis, Metabolomics, 3(3) 211-221