Download
1 / 7
80 likes | 333 Vues
Energy flow in an ecosystem . Chapter 3. Food Web in the Antarctic. Humans. Sperm whale. Blue whale. Elephant seal. Killer whale. Crabeater seal. Leopard seal. Adélie penguins. Emperor penguin. Petrel. Fish. Squid. Carnivorous plankton. Herbivorous zooplankton. Krill.

E N D
Energy flow in an ecosystem Chapter 3.
Food Web in the Antarctic Humans Sperm whale Blue whale Elephant seal Killer whale Crabeater seal Leopard seal Adélie penguins Emperor penguin Petrel Fish Squid Carnivorous plankton Herbivorous zooplankton Krill Phytoplankton Fig. 3-17, p. 48
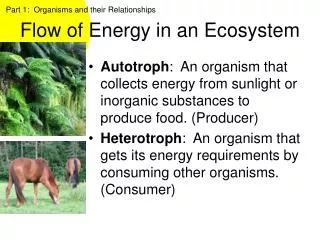
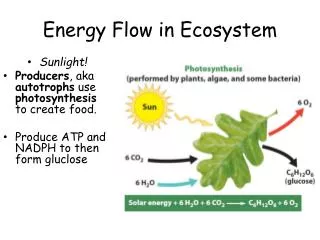
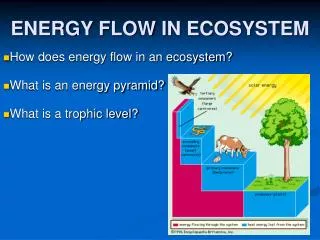
Energy Flow in an Ecosystem • Biomass • Ecological efficiency • Pyramid of energy flow
Pyramid of Energy Flow Heat Heat Decomposers Tertiary consumers (human) Heat 10 100 1,000 10,000 Usable energy available at each tropic level (in kilocalories) Secondary consumers (perch) Heat Primary consumers (zooplankton) Heat Producers (phytoplankton) Fig. 3-18, p. 49
Biomass Productivity • Gross primary productivity (GPP) • Net primary productivity (NPP) • NPP and populations
Differences between GPP and NPP Sun Photosynthesis Energy lost and unavailable to consumers Respiration Gross primary production Net primary production (energy available to consumers) Growth and reproduction Fig. 3-19, p. 49
Net Primary Productivity in Major Life Zones and Ecosystems Terrestrial Ecosystems Swamps and marshes Tropical rain forest Temperate forest Northern coniferous forest (taiga) Savanna Agricultural land Woodland and shrubland Temperate grassland Tundra (arctic and alpine) Desert scrub Extreme desert Aquatic Ecosystems Estuaries Lakes and streams Continental shelf Open ocean 800 1,600 2,400 3,200 4,000 4,800 5,600 6,400 7,200 8,000 8,800 9,600 Average net primary productivity (kcal/m2/yr) Fig. 3-20, p. 50