
Dysadherin Expression in Hepatic Cancer Cell Lines
E N D
Presentation Transcript
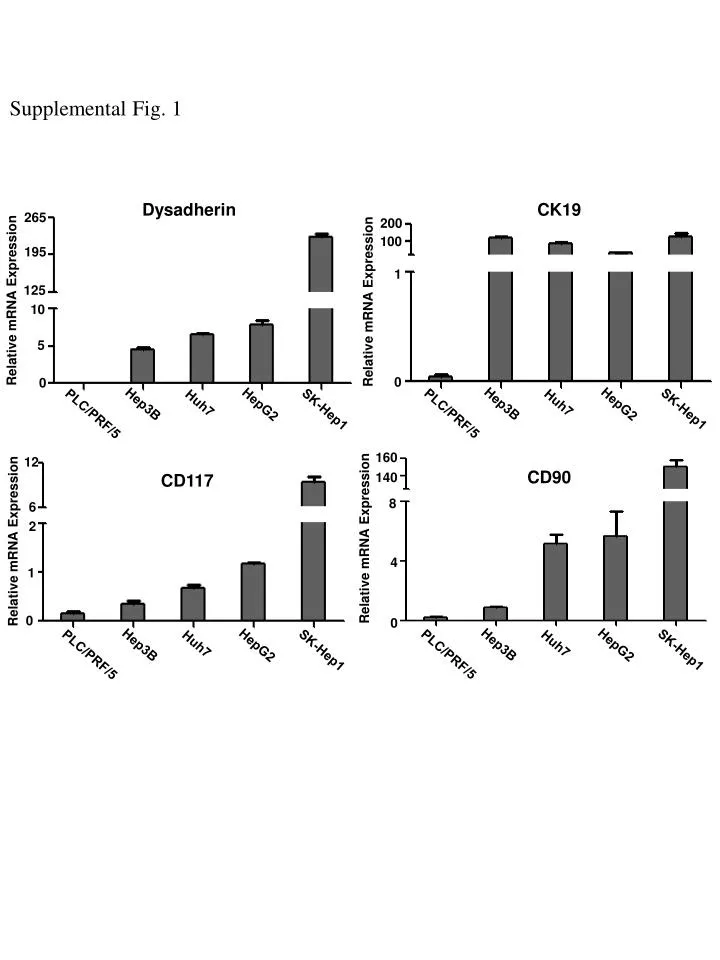
Supplemental Fig. 1 Dysadherin CK19 265 200 100 195 1 Relative mRNA Expression Relative mRNA Expression 125 10 5 0 0 Hep3B Hep3B Hep3B Hep3B HepG2 HepG2 HepG2 HepG2 SK-Hep1 SK-Hep1 SK-Hep1 SK-Hep1 PLC/PRF/5 PLC/PRF/5 PLC/PRF/5 PLC/PRF/5 Huh7 Huh7 Huh7 Huh7 160 12 CD90 140 CD117 8 6 Relative mRNA Expression Relative mRNA Expression 2 4 1 0 0
Supplemental Fig. 2 * * * * * * CTL CTL siCTL siCTL A siDys siDys 1.5 * * * NS NS NS Relative mRNA Expression 1.0 0.5 0.0 HepG2 Hep3B Huh7 * * NS NS 600 600 900 B * NS 400 400 600 200 200 300 The Number of Tumorsphere 0 0 0 Hep3B Huh7 HepG2
Supplemental Fig. 3 * * 8 A * NS 6 4 * NS 2 AV1 AL3-1 CTL CTL 0 siCTL siCTL siABCB1 siABCB1 B AV1 AL3-1 CTL siCTL siABCB1 CTL siCTL siABCB1 ABCB1 β-actin
Supplemental Fig. 4 . Gyorffy study . . 0.2 4 0.5 4 -0.0 3 3 -0.2 0.0 2 2 -0.4 1 1 -0.6 -0.5 0 0 Resistant cell lines Resistant cell lines Resistant cell lines Sensitive Cell lines Resistant cell lines Sensitive Cell lines Sensitive Cell lines Sensitive Cell lines . n=6 n=20 n=19 n=5 n=3 n=27 n=20 n=6 . Cisplatin Paclitaxel Methotrexate Doxorubicin . . . 0.5 0.5 0.5 0.0 0.0 0.0 -0.5 -0.5 -0.5 Resistant cell lines Sensitive Cell lines Resistant cell lines Sensitive Cell lines Sensitive Cell lines Resistant cell lines n=15 n=9 n=3 n=22 n=6 n=15 Topotecan Vinblastine Mitoxantrone