Download

1 / 46
460 likes | 595 Vues
Identifying Revenue & Resource Re-Allocation to Grow the University. Donna Rohlfer Director Budgeting and Business Transformation Finance and Business Services Rohlfedm@MiamiOH.edu Phyllis Wykoff Director, Business Intelligence Center IT Services Phyllis.Wykoff@MiamiOH.edu.

E N D
Identifying Revenue & Resource Re-Allocation to Grow the University
Donna Rohlfer Director Budgeting and Business Transformation Finance and Business Services Rohlfedm@MiamiOH.edu Phyllis Wykoff Director, Business Intelligence Center IT Services Phyllis.Wykoff@MiamiOH.edu
Miami University is one of the oldest public institutions in the country. It was chartered in 1809 and opened its doors to students in 1824. • Located in Southwest Ohio • Named for the Miami Indian Tribe that inhabited the area now known as the Miami Valley Region of Ohio
Enrollment Fall 2011 • Total Enrollment 23,240 • Undergraduates • Oxford: 14,936 • Hamilton: 3,672 • Middletown: 2,172 • Masters & Doctoral • Oxford: 2,299 • Voice of America Learning Center: 161 • Faculty & Staff (with GA’s) 4925 • Faculty & Staff (excluding GA’s) 4122 • College & Schools 5
Kiplingers (2012): • Once again, Miami University has been identified as a best value in Kiplinger's annual list of the • "100 Best Values in Public Colleges“ • Fiske Guide to Colleges (2013) • The Fiske Guide to Colleges 2013 includes Miami in its list of the nation's "best and most interesting colleges and universities." Recognized for strong programs in architecture, business, and music.
2012 President's Higher Education Community Service Honor Roll • One of five recipients out of 641 eligible schools in the nation to Miami's honor recognizes service programs in the area of early childhood education. • Forbes 2012 • In the magazine's 2012 list of America's Top Colleges, Miami ranks 35th in the nation and 1st in Ohio among public universities
Financial Issues Facing Higher Education • Price regulation • Increasing price elasticity • Negative demographic trends • Increased competition • Potential cuts in state funding • Increased health care costs • Rapidly rising commodity prices
Funding Sources per Student FY1990-FY2012 (1990 Inflation Adjusted $)
Special Challenges for Miami University • Limited revenue diversification • Restrictive access to some high demand programs • Slow development of new academic revenue • Inability to measure performance of initiatives • Cost cutting versus increased productivity • One time versus permanent approaches to solutions
Strategic Initiatives and Forward Thinking “...Given the very significant changes in the economy and the competitive context of higher education, more than ever it is critical that Miami be forward-looking and purposeful in fulfilling our mission...” “…prioritize and align our strategic goals with the new economic reality and competitive higher education context by creating a long-term sustainable baseline budget and identifying strategic options for improving our resource base…”
Strategic Initiative Recommendations • New Revenue Opportunities • Improve the Efficiency and Effectiveness of University Administrative and Support Functions • Included the recommendation to develop a new budget model that will result in the generation of new revenues, improved resource reallocation and greater operating efficiencies
Strategic Initiative Recommendations (cont’d) • C. Improve the Efficiency and Effectiveness of • Our Core Educational Efforts • D. Improve the Efficiency and Effectiveness of • Student Services and Co-Curricular Activities
Current Budget Model • Historical budget practices at Miami • Centralized approach • Stand-alone worksheet based model • Focus on unit actual to budget performance rather than institutional financial performance • Lack of financial performance information for academic programs or support centers
Considerations in Developing a New Budget Model • Impact of governance on planning and decision-making • Historical clustering of academic programs • Industry and customer (student) connections occur at the unit level • Successful change requires strong unit support driven by clear incentives and rewards
New Budget Model • More effective measure of financial performance for every academic program • Where are my revenues being generated? • How are resources consumed to generate these revenues? • Who is enrolled in my courses? • Decentralized system increases influence of academic divisions over financial planning and resource allocation decisions
New Budget Model (cont’d) • Better assures financial issues are considered in academic program decisions • What is capacity? • What does this cost to offer? • What is net revenue? • Provides very clear incentives for improved financial performance • How to determine the method of revenue allocation?
Help! We need data!
They asked for data— But we delivered Information!
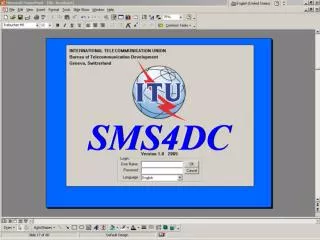
Our Environment • Ellucian Banner ERP • Primarily an Oracle shop • Business Intelligence tool is • Oracle Business Intelligence Enterprise Edition (OBIEE)
Vice President Finance & Business Affairs Cross Functional Core Team Vice President IT Services Provost Academic Affairs Assoc. VP Finance & Business Assoc. VP Budget & Analysis Sr. Director, Enterprise Information Systems Asst Director Continuing Education Controller Bursar Director, Business Intelligence Asst Registrar Budget Director Director, Financial Assistance Business Intelligence Team Members and Analysts Director, Institutional Research Subject Matter Experts (SMEs) as needed Working committees as needed
Data Sources • Registration data – Who is taking each course? • Bursar data – How much was each student charged? • Undergraduate, Graduate, Campus, Residency • Bursar data – How much did each student pay? • Waivers • Financial Aid – Authorized Financial Aid
Registration data • Student based data • Course data • Section data • Registration data • Instructor • Credit hours • Headcounts • This is not an enrollment view of registration data but rather a Bursar’s view of registration.
Bursar Data • Student Based Revenue processed through Bursar • Instructional Fee • General Fee • Course Specific (Equestrian courses) • Program Specific (Architecture students) • Lab Fees (Chemistry) • Divisional Fee (Business Surcharge)
Financial Aid • External Financial Aid • Institutionally Funded Financial Aid • Expense to University • Institutional discount rate
Reality Sets In… • Business practices have changed • Some data was obsolete • Some data usage changed over time • Some data was just wrong • Some data was missing
Reality of Source Data • 7500+ Detail (charge) Codes used since 1999 • 1300+ Detail Codes for Tuition • No distinction between General, Out of State or Instructional Fee • No easy way to organize or analyze the data • Charges by credit hour, not by course
Classification of Bursar Codes • Created a five level hierarchy for EACH detail code. • Detail Code 0106 “UG Instructional Fee – 1stSem” • Level 1 – Revenue • Level 2 – Tuition and Fees • Level 3 – Instructional Regular • Level 4 – UG Instructional Regular • Level 5 - blank • Detail Code C11S “Class of 2011 Scholarship” • Level 1 – Expense • Level 2 – Tuition Aid • Level 3 – Scholarship • Level 4 – Internal • Level 5 – Instructional
Convert Fees/Waivers to be Course-based • Miami University’s fee structure is based on credit hours attempted, not per course • Pro-rated fees, waivers, financial aid • Calculated per credit hour rate and applied to course by credit hours for each student • $10,000 in instructional fee, 10 credit hours • Calculated per credit hour rate of $1,000 per hour • 3 credit hour course ‘price’ $3,000
A Star is Born • Created a dimensional model (star schema) that: • Combined the data from multiple data silos • Added derived measures (fees/waivers • per student per class per term) • Added derived fields (financial cohort) • Added hierarchies for analytical capabilities • OBIEE used to create Executive level dashboard • And Management level reports • And Ad hoc query tool for further analysis
Additional Project Benefits • Model provides single version of the data • All analyses and queries provide the same numbers • Provided the information needed to move forward with Responsibility Center Management • Demonstrated the power of Business Intelligence to address strategic needs • Demonstrated the value of eliminating data silos
Project issue and challenges • Testing • Categorizing the same data for different user needs and applications • Testing • Merging the need for: • Exclusive and exhaustive data granularity • Analytics • Executive dashboards • Management level reporting • From ONE data source!
Project issue and challenges • Testing • Metadata management • Data visualization – Design and Testing • Training – BI concepts, new tools
Learnings • BI requires commitment, input and work from both IT • and from the business users. • No one person understands all the data and implications • Talk to a wide range of people to get the entire picture • Validate, validate, validate • New way to look at data • Prove it ties to source data on a daily basis • Data validation • Immediate notification data issues • Context is important • Data cube is both powerful and dangerous
Best Practices • Allow reasonable timeframe • Use project management methodology • Have the right people at the table • Accountability • Everyone contributes, everyone questions • Commitment to the project from top down • Implies regular attendance at meetings • The project sponsor sets the tone by showing up and participating • Moves the project forward • Sub-groups address specific issues and topics • Document, document, document
Where are we now? • Data Warehouse developed and deployed using OBIEE • Learning curve – new technology, new processes • Testing – took a huge amount of time for IT staff and for functional staff • Training – multiple tools to learn
The original questions • Where are my revenues being generated? • How are resources consumed to generate these revenues? • Who is enrolled in my courses? • What is capacity? • What does this cost to offer? • What is net revenue? • How to determine the method of revenue allocation?
Clients view of solution Miami University's investment in institutional analytics has provided huge dividends for our institution. First, it has added a level of sophistication to our understanding of how our business practices are reflected in our ERP. Second, the design work has resulted in closer alignment of our analytical corps across the university. And, last but not least, it is supporting strategic conversations around budgeting and finance that were not possible without this capacity. The promise of IA going forward is that Miami University will have stronger management and more insight into strategic implications of our decisions. ---David Ellis, Associate Vice President, Budget and Analysis