Download
1 / 31
310 likes | 386 Vues
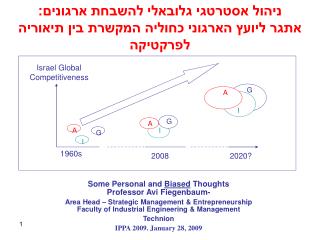
ניהול אסטרטגי גלובאלי להשבחת ארגונים: אתגר ליועץ הארגוני כחוליה המקשרת בין תיאוריה לפרקטיקה. Israel Global Competitiveness. I. A. A. A. G. G. G. I. I. 1960s. 2008. 2020?. Some Personal and Biased Thoughts Professor Avi Fiegenbaum-

E N D
ניהול אסטרטגי גלובאלי להשבחת ארגונים: אתגר ליועץ הארגוני כחוליה המקשרת בין תיאוריה לפרקטיקה Israel Global Competitiveness I A A A G G G I I 1960s 2008 2020? Some Personal and Biased ThoughtsProfessor Avi Fiegenbaum- Area Head – Strategic Management & EntrepreneurshipFaculty of Industrial Engineering & Management Technion IPPA 2009. January 28, 2009 1
G A I A. “GI” Challenges C. “SM” Offerings B. “OC” Challenges D. OC-SM Future Challenges for AGI 1 - Israel 2028:Global, Periphery & Traditional Industries ממשלה: שרים 2020? יועצים 2020?
יועץ – מה עלי לעשות לקראת 2028? G A I A. “GI” Challenges C. “SM” Offerings B. “OC” Challenges D. OC-SM Future ? 3
Management – OC Challenges 1: Top Down & Bottom Up G A I C. “SM” Offerings A. “GI” Challenges B. “OC” Challenges D. OC-SM Future “GI” Vision 2028 Levels: A. Knowledge Creation B. Knowledge Transformation C. Knowledge Application Academia (mgt) Consultants (“Best Practices”) • Teaching • Degree • Non degree Industry 1 Industry 2 Industry N Government 1 Government 2 Government M 4
Organizational Consultants Challenges 2: Bridging “AGI” G A I A. “GI” Challenges C. “SM” Offerings B. “OC” Challenges D. OC-SM Future Themes-Methodologies (“A”) Context (“GI”) SM Traditional OC SM • OCSM • Individual + ? • Group + ? • Organization + ? • Industry/Environment ? Knowledge Base (“A”) 5
The Strategic Challenge 1: Mid 1990s: The CEO-Chair? • Industry: High tech • Divisions: 3 • Performance: • Total Sales: $ 800 M • Profit: $ 30 M • Market value: $ 200 M G A I A. “GI” Challenges A. “SM” Offerings B. “OC” Challenges B. OC-SM Future
The Strategic Challenge 2: Israeli High Tech 1990s G A I A. “GI” Challenges A. “SM” Offerings B. “OC” Challenges B. OC-SM Future • 19902000 • Financial Markets: • # of Companies NASDAQ 7 120 • Market Value $ O.5 B $ 130 B • # of VC 2 70 • VC Total Fund $ 0.1B $ 3B • Technological Markets • # of Technological Incubators 0 23 • # of Start Ups Few Thousands
The Strategic Challenge 3: Israeli 2020? ? I II III IV 1990 2000 2015 G A I A. “GI” Challenges A. “SM” Offerings B. OC-SM Future B. “OC” Challenges • Why? • Can others learn from? • Will Israel high tech re surge? • Who is responsible (“the invisible hand”)?
THEORETCIAL PERSPECTIVE I: STRATEGYY IS ABOUT RISK TAKING – What Reference Point? 9,000,000 P = 100 % G A P = 10 % P = 90 % I 9,000,000 0 10,000,000 A. “GI” Challenges A. “SM” Offerings B. “OC” Challenges B. OC-SM Future
THEORETCIAL PERSPECTIVE II: STRATEGY: Global Competitive Space G A I Failure Narcissist Amorphic Competitive External Low High High Low Internal A. “GI” Challenges A. “SM” Offerings B. OC-SM Future B. “OC” Challenges Time • Future External • Present • Past • Customers • Suppliers • Competitors • Capabilities • Vision Internal
THEORETCIAL PERSPECTIVE III: STRATEGY: System Management A. CEO- Chair F. Industry E. Alliance G A D. Corporate I C. SBU B. Performance A. “GI” Challenges A. “SM” Offerings B. “OC” Challenges B. OC-SM Future A. CEO-Board • LEADERSHIP-ADAPTATION • PERFORMANCE (B) • INSIDE (A,C,D)-OUTSIDE (E,F)
B1. Balance Short-Long Term Long-Term: MV “Fantasizer” Leader G A Manager I Short-Term: ROE-MS B. Performance A. “GI” Challenges A. “SM” Offerings B. OC-SM Future B. “OC” Challenges A. CEO-Chair F. Industry E. Alliance D. Corporate C. SBU
Competitive Diagnostic A. CEO-Chair F. Industry High Short Term Low 2.Exploitation 1. Strategic E. Alliance 3. Exploration 4. Failure G A Low High Long Term D. Corporate I C. SBU B. Performance A. “GI” Challenges A. “SM” Offerings B. “OC” Challenges B. OC-SM Future
Implementation 1 A. CEO-Chair F. Industry E. Alliance G A D. Corporate I C. SBU B. Performance A. “GI” Challenges A. “SM” Offerings B. “OC” Challenges B. OC-SM Future • Relative to LOCAL-------------- Global ------- - Value • A. Short Term: • ROE ------ 1 2 3 4 5 • ROE Change ------ 1 2 3 4 5 • SALES ------ 1 2 3 4 5 • SALES Change ------ 1 2 3 4 5 • Other ------ 1 2 3 4 5 • Average: 1 2 3 4 5 • B. Long Term: • MV ----- 1 2 3 4 5 • MV Change ----- 1 2 3 4 5 • Dividend ----- 1 2 3 4 5 • Other ----- 1 2 3 4 5 • Average: 1 2 3 4 5
1. COMPETITIVE ADVANTAGES? A. CEO-Chair F. Industry E. Alliance Cost- Leadership Differentiation Broad Scope G A Cost – Focus Differentiation - Focus D. Corporate Narrow I Cost Differentiation C. SBU Competitive Advantage B. Performance A. “GI” Challenges A. “SM” Offerings B. “OC” Challenges B. OC-SM Future
Implementation 2 A. CEO-Chair F. Industry E. Alliance G A D. Corporate I C. SBU B. Performance A. “GI” Challenges A. “SM” Offerings B. “OC” Challenges B. OC-SM Future • Relative to LOCAL-------------- Global ------- - Value • A. Cost reduction: • Production ------ 1 2 3 4 5 • Marketing ------ 1 2 3 4 5 • Logistics ------ 1 2 3 4 5 • Encouraged ------ 1 2 3 4 5 • Other ------ 1 2 3 4 5 • Average: 1 2 3 4 5 • B. Innovation • Production ----- 1 2 3 4 5 • Marketing ----- 1 2 3 4 5 • Logistics ----- 1 2 3 4 5 • Encouraged ----- 1 2 3 4 5 • Average: 1 2 3 4 5
G A I A. “GI” Challenges A. “SM” Offerings B. “OC” Challenges B. OC-SM Future D. Corporate Level Strategy: Empirical Findings Sales Earning EPS ROC ROE GrowthGrowthGrowth 1. SINGLE FIRM 7.17-- 4.81-- 3.92-- 10.81-- 13.20 2. DOMINANT FIRM 7.42-- 7.34 5.14- 8.24--- 10.18--- 3. RELATED DIVER. 9.62 10.39+++ 8.56+ 11.97+++ 14.11+++ 4. UNRELATED DIVER. 20.64+++ 18.64+++ 9.56+++ 9.56 10.38-
Global Trans- National Cost High Global Synergisms G A Inter- National MNE Low I Low High Local Responsiveness Differences A. “GI” Challenges A. “SM” Offerings B. “OC” Challenges B. OC-SM Future 1.GLOBAL STRATEGY SUCCESS? How?
A. CEO-Chair F. Industry Global Integration (Cost) E. Alliance 3. Division 2. Division G A 1. Division D. Corporate I Local Responsiveness (Differentiation C. Business B. MNE: Performance A. “GI” Challenges A. “SM” Offerings B. “OC” Challenges B. OC-SM Future 2. DIFFERENTIAED ORGANIZATION?
Implementation 3 A. CEO-Chair F. Industry E. Alliance G A D. Corporate I C. SBU B. Performance A. “GI” Challenges A. “SM” Offerings B. “OC” Challenges B. OC-SM Future • Relative to LOCAL-------------- Global ------- - Value • A. Tangible Synergism • Production ------ 1 2 3 4 5 • Marketing ------ 1 2 3 4 5 • Logistics ------ 1 2 3 4 5 • Encouraged ------ 1 2 3 4 5 • Other ------ 1 2 3 4 5 • Average: 1 2 3 4 5 • B. Intangible Synergism • Production ----- 1 2 3 4 5 • Marketing ----- 1 2 3 4 5 • Logistics ----- 1 2 3 4 5 • Encouraged ----- 1 2 3 4 5 • Average: 1 2 3 4 5
A. CEO-Chair F. Industry E. Alliance G A D. Corporate I C. Business B. MNE: Performance A. “GI” Challenges A. “SM” Offerings B. “OC” Challenges B. OC-SM Future STRUCTURAL EVOLUTION Number of Alliances:
A. CEO-Chair F. Industry E. Alliance G A D. Corporate I C. Business B. Performance A. “GI” Challenges A. “SM” Offerings B. “OC” Challenges B. OC-SM Future WHY STRATEGIC ALLIANCES? • Pros: • Information • High Cost of Entry • Risk Reduction • Quick Entry • Quick Exit • Standards • Cons: • Coordination • Changing Goals • “Hollow Organization”
A. CEO-Chair F. Industry High Structural Efficiency Low 2. Amorphic 1. Strategic E. Alliance 3. Myopic 4. Failure G A Low High Relational Efficiency D. Corporate I C. Business B. Performance A. “GI” Challenges A. “SM” Offerings B. OC-SM Future B. “OC” Challenges Managing Network Synergisms
Implementation 4 A. CEO-Chair F. Industry E. Alliance G A D. Corporate I C. SBU B. Performance A. “GI” Challenges A. “SM” Offerings B. “OC” Challenges B. OC-SM Future • Relative to LOCAL-------------- Global ------- - Value • A. Tangible Synergism • Production ------ 1 2 3 4 5 • Marketing ------ 1 2 3 4 5 • Logistics ------ 1 2 3 4 5 • Encouraged ------ 1 2 3 4 5 • Other ------ 1 2 3 4 5 • Average: 1 2 3 4 5 • B. Intangible Synergism • Production ----- 1 2 3 4 5 • Marketing ----- 1 2 3 4 5 • Logistics ----- 1 2 3 4 5 • Encouraged ----- 1 2 3 4 5 • Average: 1 2 3 4 5
G A I A. “GI” Challenges A. “SM” Offerings B. “OC” Challenges B. OC-SM Future INDUSTRY ATTRACTIVNESS • Demand: • Total size • Growth rate • Segmentations • Competition: • Buyers • Suppliers • Threat of new entrants • Threat of substitute products • Rivalry among existing companies
A. CEO-Chair F. Industry High Demand Low 2. Growth 1. Strategic E. Alliance 3. Efficiency 4. Failure G A High Low Competition D. Corporate I C. Business B. Performance A. “GI” Challenges A. “SM” Offerings B. OC-SM Future B. “OC” Challenges Industry Attractiveness
Implementation 5 A. CEO-Chair F. Industry E. Alliance G A D. Corporate I C. SBU B. Performance A. “GI” Challenges A. “SM” Offerings B. “OC” Challenges B. OC-SM Future • Relative to LOCAL-------------- Global ------- - Value • A. Competition • Customers ------ 1 2 3 4 5 • Suppliers ------ 1 2 3 4 5 • New entrants ------ 1 2 3 4 5 • Product substitute ------ 1 2 3 4 5 • Rivalry ------ 1 2 3 4 5 • Average: 1 2 3 4 5 • B. Demand • Size ----- 1 2 3 4 5 • Growth rate ----- 1 2 3 4 5 • Segmentation ----- 1 2 3 4 5 • Average: 1 2 3 4 5
G A I A. “GI” Challenges A. “SM” Offerings B. “OC” Challenges B. OC-SM Future CEO-CHIAR: GLOBAL STRATEGIC EVLAUTION • 1 2 3 4 5 • Not at all Agree • Has a global & strategic model to enhance MV 1 2 3 4 5 • Gets the right information with out asking 1 2 3 4 5 • Affects the company strategy 1 2 3 4 5 • Affectsshort term performance (ROE) 1 2 3 4 5 • Affects long term performance (MV) 1 2 3 4 5 • In sum, I am happy with the chairman-BOD • Contribution to the company 1 2 3 4 5
CEO- Chair: Global Strategic Management Model to Enhance Market Value C1 C1 C1 C1 C1 C1 C1 C2 C2 C2 C2 C2 C2 C2 G A I A. “GI” Challenges A. “SM” Offerings B. OC-SM Future B. “OC” Challenges
2020: Co Evolution:Traditional Industries & High Tech? Traditional Industries Traditional Industries G A High Tech High Tech I A. “SM” Offerings A. “GI” Challenges B. OC-SM Future B. “OC” Challenges Israel Global Competitiveness 40K 17K 10K • Innovation • Social Capital, • Entrepreneurship 1960s 2008 2020?
Shoot to the moon, even if you miss, you still will be among, stars … Thank You