Download
1 / 108
1.08k likes | 1.49k Vues
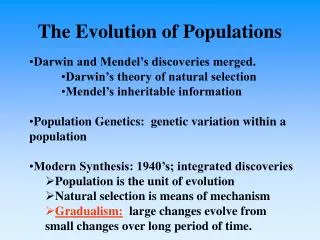
The Evolution of Populations. 0. 21. Overview: The Smallest Unit of Evolution. One common misconception is that organisms evolve during their lifetimes Natural selection acts on individuals, but only populations evolve

E N D
Overview: The Smallest Unit of Evolution One common misconception is that organisms evolve during their lifetimes Natural selection acts on individuals, but only populations evolve Consider, for example, a population of medium ground finches on Daphne Major Island During a drought, large-beaked birds were more likely to crack large seeds and survive The finch population evolved by natural selection
Figure 21.2 10 9 Average beak depth (mm) 8 0 1976 (similar to the prior 3 years) 1978 (after drought)
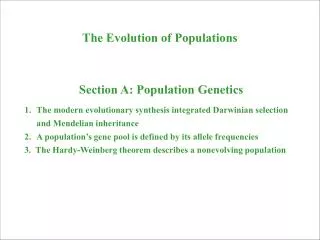
Microevolution is a change in allele frequencies in a population over generations Three mechanisms cause allele frequency change Natural selection Genetic drift Gene flow Only natural selection causes adaptive evolution
Variation in heritable traits is a prerequisite for evolution Mendel’s work on pea plants provided evidence of discrete heritable units (genes) Concept 21.1: Genetic variation makes evolution possible
Genetic Variation Phenotypic variation often reflects genetic variation Genetic variation among individuals is caused by differences in genes or other DNA sequences Some phenotypic differences are due to differences in a single gene and can be classified on an “either-or” basis Other phenotypic differences are due to the influence of many genes and vary in gradations along a continuum
Genetic variation can be measured at the whole gene level as gene variability Gene variability can be quantified as the average percent of loci that are heterozygous
Genetic variation can be measured at the molecular level of DNA as nucleotide variability Nucleotide variation rarely results in phenotypic variation Most differences occur in noncoding regions (introns) Variations that occur in coding regions (exons) rarely change the amino acid sequence of the encoded protein
Figure 21.4 Base-pair substitutions Insertion sites 1 500 1,000 Intron Exon Substitution resulting in translation of different amino acid Deletion 1,500 2,000 2,500
Phenotype is the product of inherited genotype and environmental influences Natural selection can only act on phenotypic variation that has a genetic component
Figure 21.5 (a) Caterpillars raised on a diet of oak flowers (b) Caterpillars raised on a diet of oak leaves
Figure 21.5a (a) Caterpillars raised on a diet of oak flowers
Figure 21.5b (b) Caterpillars raised on a diet of oak leaves
Sources of Genetic Variation New genes and alleles can arise by mutation or gene duplication
Formation of New Alleles A mutation is a change in the nucleotide sequence of DNA Only mutations in cells that produce gametes can be passed to offspring A “point mutation” is a change in one base in a gene
The effects of point mutations can vary Mutations in noncoding regions of DNA are often harmless Mutations to genes can be neutral because of redundancy in the genetic code
The effects of point mutations can vary Mutations that alter the phenotype are often harmful Mutations that result in a change in protein production can sometimes be beneficial
Altering Gene Number or Position Chromosomal mutations that delete, disrupt, or rearrange many loci are typically harmful Duplication of small pieces of DNA increases genome size and is usually less harmful Duplicated genes can take on new functions by further mutation An ancestral odor-detecting gene has been duplicated many times: Humans have 350 functional copies of the gene; mice have 1,000
Rapid Reproduction Mutation rates are low in animals and plants The average is about one mutation in every 100,000 genes per generation Mutation rates are often lower in prokaryotes and higher in viruses Short generation times allow mutations to accumulate rapidly in prokaryotes and viruses
Sexual Reproduction In organisms that reproduce sexually, most genetic variation results from recombination of alleles Sexual reproduction can shuffle existing alleles into new combinations through three mechanisms: crossing over, independent assortment, and fertilization
Concept 21.2: The Hardy-Weinberg equation can be used to test whether a population is evolving The first step in testing whether evolution is occurring in a population is to clarify what we mean by a population
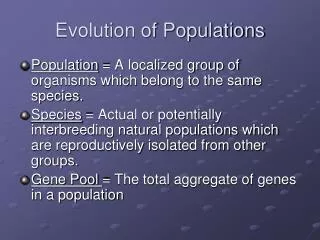
Gene Pools and Allele Frequencies A population is a localized group of individuals capable of interbreeding and producing fertile offspring A gene pool consists of all the alleles for all loci in a population An allele for a particular locus is fixed if all individuals in a population are homozygous for the same allele
Figure 21.6 Porcupine herd MAP AREA CANADA ALASKA Beaufort Sea NORTHWEST TERRITORIES Porcupine herd range Fortymile herd range YUKON ALASKA Fortymile herd
Figure 21.6a Porcupine herd
Figure 21.6b Fortymile herd
The frequency of an allele in a population can be calculated For diploid organisms, the total number of alleles at a locus is the total number of individuals times 2 The total number of dominant alleles at a locus is 2 alleles for each homozygous dominant individual plus 1 allele for each heterozygous individual; the same logic applies for recessive alleles
By convention, if there are 2 alleles at a locus, p and q are used to represent their frequencies The frequency of all alleles in a population will add up to 1 For example, pq 1
Figure 21.UN01 CRCR CWCW CRCW
For example, consider a population of wildflowers that is incompletely dominant for color 320 red flowers (CRCR) 160 pink flowers (CRCW) 20 white flowers (CWCW) Calculate the number of copies of each allele CR (320 2) 160 800 CW (20 2) 160 200
To calculate the frequency of each allele p freq CR 800 / (800 200) 0.8 (80%) q 1 p 0.2 (20%) The sum of alleles is always 1 0.8 0.2 1
The Hardy-Weinberg Principle The Hardy-Weinberg principle describes a population that is not evolving If a population does not meet the criteria of the Hardy-Weinberg principle, it can be concluded that the population is evolving
The Hardy-Weinberg principle states that frequencies of alleles and genotypes in a population remain constant from generation to generation In a given population where gametes contribute to the next generation randomly, allele frequencies will not change Mendelian inheritance preserves genetic variation in a population Hardy-Weinberg Equilibrium
Hardy-Weinberg equilibriumdescribes the constant frequency of alleles in such a gene pool Consider, for example, the same population of 500 wildflowers and 1,000 alleles where p freq CR 0.8 q freq CW 0.2
Figure 21.7 Frequencies of alleles p frequency of CR allele 0.8 0.2 q frequency of CW allele Alleles in the population Gametes produced Each egg: Each sperm: 80% chance 20% chance 20% chance 80% chance
The frequency of genotypes can be calculated CRCRp2 (0.8)2 0.64 CRCW 2pq 2(0.8)(0.2) 0.32 CWCWq2 (0.2)2 0.04 The frequency of genotypes can be confirmed using a Punnett square
Figure 21.8 20% CW (q 0.2) 80% CR (p 0.8) Sperm CR CW p 0.8 q 0.2 CR p 0.8 0.64(p2) CRCR 0.16(pq) CRCW Eggs CW 0.16(qp) CRCW 0.04(q2) CWCW q 0.2 64% CRCR,32% CRCW,and4% CWCW Gametes of this generation: 64% CR (from CRCR plants) 16% CR (from CRCW plants) 80% CR 0.8 p 16% CW (from CRCW plants) 4% CW (from CWCW plants) 20% CW 0.2 q With random mating, these gametes will result in the same mix of genotypes in the next generation: 64% CRCR,32% CRCW,and4% CWCWplants
Figure 21.8a 80% CR (p 0.8) 20% CW (q 0.2) Sperm CW CR p 0.8 q 0.2 CR p 0.8 0.64(p2) CRCR 0.16(pq) CRCW Eggs CW 0.04(q2) CWCW 0.16(qp) CRCW q 0.2
Figure 21.8b 64% CRCR,32% CRCW,and4% CWCW Gametes of this generation: 16% CR (from CRCW plants) 64% CR (from CRCR plants) 80% CR 0.8 p 4% CW (from CWCW plants) 16% CW (from CRCW plants) 20% CW 0.2 q With random mating, these gametes will result in the same mix of genotypes in the next generation: 64% CRCR,32% CRCW,and4% CWCWplants
If p and q represent the relative frequencies of the only two possible alleles in a population at a particular locus, then p2 2pqq2 1 where p2 and q2 represent the frequencies of the homozygous genotypes and 2pq represents the frequency of the heterozygous genotype
Conditions for Hardy-Weinberg Equilibrium The Hardy-Weinberg theorem describes a hypothetical population that is not evolving In real populations, allele and genotype frequencies do change over time
The five conditions for nonevolving populations are rarely met in nature No mutations Random mating No natural selection Extremely large population size No gene flow
Natural populations can evolve at some loci while being in Hardy-Weinberg equilibrium at other loci Some populations evolve slowly enough that evolution cannot be detected
Applying the Hardy-Weinberg Principle We can assume the locus that causes phenylketonuria (PKU) is in Hardy-Weinberg equilibrium given that The PKU gene mutation rate is low Mate selection is random with respect to whether or not an individual is a carrier for the PKU allele
Natural selection can only act on rare homozygous individuals who do not follow dietary restrictions The population is large Migration has no effect, as many other populations have similar allele frequencies
The occurrence of PKU is 1 per 10,000 births q2 0.0001 q 0.01 The frequency of normal alleles is p 1 – q 1 – 0.01 0.99 The frequency of carriers is 2pq 2 0.99 0.01 0.0198 or approximately 2% of the U.S. population
Three major factors alter allele frequencies and bring about most evolutionary change Natural selection Genetic drift Gene flow Concept 21.3: Natural selection, genetic drift, and gene flow can alter allele frequencies in a population
Natural Selection Differential success in reproduction results in certain alleles being passed to the next generation in greater proportions For example, an allele that confers resistance to DDT increased in frequency after DDT was used widely in agriculture