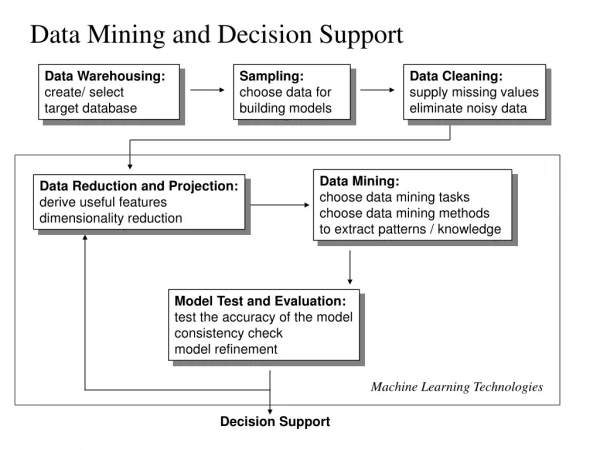
Decision Tree Models in Data Mining
Decision Tree Models in Data Mining. Matthew J. Liberatore Thomas Coghlan. Decision Trees in Data Mining . Decision Trees can be used to predict a categorical or a continuous target (called regression trees in the latter case)

Decision Tree Models in Data Mining
E N D
Presentation Transcript
Decision Tree Models in Data Mining Matthew J. Liberatore Thomas Coghlan
Decision Trees in Data Mining • Decision Trees can be used to predict a categorical or a continuous target (called regression trees in the latter case) • Like logistic regression and neural networks decision trees can be applied for classification and prediction • Unlike these methods no equations are estimated • A tree structure of rules over the input variables are used to classify or predict the cases according to the target variable • The rules are of an IF-THEN form – for example: • If Risk = Low, then predict on-time payment of a loan
Decision Tree Approach • A decision tree represents a hierarchical segmentation of the data • The original segment is called the root node and is the entire data set • The root node is partitioned into two or more segments by applying a series of simple rules over an input variables • For example, risk = low, risk = not low • Each rule assigns the observations to a segment based on its input value • Each resulting segment can be further partitioned into sub-segments, and so on • For example risk = low can be partitioned into income = low and income = not low • The segments are also called nodes, and the final segments are called leaf nodes or leaves
Decision Tree Example – Loan Payment Income < $30k >= $30k Age Credit Score < 25 >=25 < 600 >= 600 not on-time on-time not on-time on-time
Growing the Decision Tree • Growing the tree involves successively partitioning the data – recursively partitioning • If an input variable is binary, then the two categories can be used to split the data • If an input variable is interval, a splitting value is used to classify the data into two segments • For example, if household income is interval and there are 100 possible incomes in the data set, then there are 100 possible splitting values • For example, income < $30k, and income >= $30k
Evaluating the partitions • When the target is categorical, for each partition of an input variable a chi-square statistic is computed • A contingency table is formed that maps responders and non-responders against the partitioned input variable • For example, the null hypothesis might be that there is no difference between people with income <$30k and those with income >=$30k in making an on-time loan payment • The lower the significance or p-value, the more likely that we reject this hypothesis, meaning that this income split is a discriminating factor
Chi-Square Statistic • The chi-square statistic computes a measure of how different the number of observations is in each of the four cells as compared to the expected number • The p-value associated with the null hypothesis is computed • Enterprise Miner then computes the logworth of the p-value, logworth = - log10(p-value) • The split that generates the highest logworth for a given input variable is selected
Growing the Tree • In our loan payment example, we have three interval-valued input variables: income, age, and credit score • We compute the logworth of the best split for each of these variables • We then select the variable that has the highest logworth and use its split – suppose it is income • Under each of the two income nodes, we then find the logworth of the best split of age and credit score and continue the process -- • subject to meeting the threshold on the significance of the chi-square value for splitting and other stopping criteria (described later)
Other Splitting Criteria for a Categorical Target • The gini and entropy measures are based on how heterogeneous the observations are at a given node • relates to the mix of responders and non-responders at the node • Let p1 andp0 represent the proportion of responders and non-responders at a node, respectively • If two observations are chosen (with replacement) from a node, the probability that they are either both responders or both non-responders is (p1)2 +(p0)2 • The gini index = 1 – [(p1)2 +(p0)2], the probability that both observations are different • Best case is a gini index of 0 (all observations are the same) • An index of ½ means both groups equally represented
Other Splitting Criteria for a Categorical Target • The rarity of an event is defined as: -log2(pi) • Entropy sums up the rarity of response and non-response over all observations • Entropy ranges from the best case of 0 (all responders or all non-responders) to 1 (equal mix of responders and non-responders)
Splitting Criteria for a Continuous (Interval) Target • An F-statistic is used to measure the degree of separation of a split for an interval target, such as revenue • Similar to the sum of squares discussion under multiple regression, the F-statistic is based on the ratio of the sum of squares between the groups and the sum of squares within groups, both adjusted for the number of degrees of freedom • The null hypothesis is that there is no difference in the target mean between the two groups • As before, the logworth of the p-value is computed
Some Adjustments • The more possible splits of an input variable, the less accurate the p-value (bigger chance of rejecting the null hypothesis) • If there are m splits, the Bonferroni adjustment adjusts the p-value of the best case by subtracting log10(m) from the logworth • If Time of Kass Adjustment is set to before then the p-values of the splits are compared with Bonferroni adjustment
Some Adjustments • Setting Split Adjustment property to Yes means that the significance of the p-value can be adjusted by the depth of the tree • For example, at the fourth split, a calculate p-value of 0.04 becomes 0.04*24 = 0.64, making the split statistically insignificant • This leads to rejecting more splits, limiting the size of the tree • Tree growth can also be controlled by setting: • Leaf Size property (minimum number of observations in a leaf) • Split Size property (minimum number of observations to allow a node to be split) • Maximum Depth property (maximum number of generation of nodes)
Some Results • The posterior probabilities are the proportions of responders and non-responders at each node • A node is classified as a responder or non-responder depending on which posterior probability is the largest • In selecting the best tree, one can use Misclassification, Lift, or Average Squared Error
Creating a Decision Tree Model in Enterprise Miner • Open the bankrupt project, and create a new diagram called Bankrupt_DecTree • Drag and drop the bankrupt data node and the Decision Tree node (from the model tab) onto the diagram • Connect the nodes
Select ProbChisq for the Criterion under Splitting RuleChange Use Input Once to Yes (otherwise, the same variable can appear more than once in the tree)
Under Subtree select Misclassification for Assessment MeasureKeep defaults under P-Value Adjustment and Output VariablesUnder Score set Variable Selection to No (otherwise variables with importance values greater than 0.05 are set as rejected and not considered by the tree)
The Decision Tree has only one split on RE/TA. The misclassification rate is 0.15 (3/20), with 2 false negatives and 1 false positive. The cumulative lift is somewhat lower than the best cumulative lift, and starts out at 1.777 vs. the best value of 2.000.
Under Subtree, set Method to Largest and rerun. The result show that another split is added, using EBIT/TA. However, the misclassification rate is unchanged at 0.15. This result shows that setting Method to Assessment and Misclassification for Assessment Measure finds the smallest tree having the lowest misclassification
Model Comparison • The Model Comparison node under the Assess tab can be used to compare several different models • Create a diagram called Full Model that includes the bankrupt data node connected into the regression, decision tree, and neural network nodes • Connect the three model nodes into the Model Comparison node, and connect it and the bankrupt_score data node into a Score node
For Regression, set Selection Model to none; for Neural Network, set Model Selection Criterion to Average Error, and the Network properties as before; for Decision Tree, set Assessment Measure as Average Squared Error, and the other properties as before. This puts each of the models on a similar basis for fit. For Model Comparison set Selection Criterion as Average Squared Error.
Neural Network is selected, although Regression is nearly identical in average squared error. The Receiver Operating Characteristic (ROC) curve shows sensitivity (true positives) vs. 1-specificity (false positives) for various cutoff probabilities of a response. The chart shows that no matter what the cutoff probabilities are, regression and neural network classify 100% of responders as responders (sensitivity) and 0% of non-responders as responders (1-specificity). Decision tree performs reasonably well, as indicated by the area above the diagonal line.