Download
1 / 76
760 likes | 867 Vues
Explore the relationship between income and well-being, the impact of economic growth on happiness, and the role of unemployment, inflation, and welfare benefits in societal happiness. Discover the importance of measuring social progress beyond GDP and incorporating subjective well-being data in statistical analysis. Dive into studies on relative income comparisons, geographical happiness patterns, and the paradox of high suicide rates in seemingly happy places. Consider the implications of societal comparisons on individual well-being and happiness.

E N D
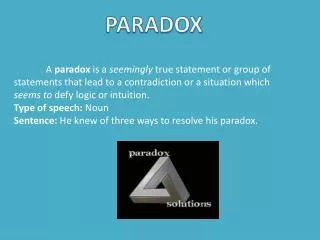
Easterlin’s Paradox and the Macroeconomics of Happiness Andrew Oswald Warwick and IZA I would like to acknowledge that much of this work is joint with coauthors Andrew Clark, Nick Powdthavee, David G. Blanchflower, and Steve Wu.
This is an empirical question • "Does Economic Growth Improve the Human Lot?" Richard Easterlin in Paul A. David and Melvin W. Reder, eds., Nations and Households in Economic Growth: Essays in Honor of Moses Abramovitz, New York: Academic Press, Inc., 1974.
The relationship between income and well-being in Japan over 25 years
The macroeconomics of happiness Countries are happier if they have low unemployment and inflation, and generous welfare benefits.
The macroeconomics of happiness Countries are happier if they have low unemployment and inflation, and generous welfare benefits. ‘Fear’ depresses happiness. R. Di Tella, R. Macculloch, A.J. Oswald American Economic Review, 2001.
In a recession there is a widespread decline in mental well-being, we think because of the generalized insecurity.
In the early 70s, 33% of Americans described their lives as very happy, 52% as pretty happy, and 15% as not too happy.
In the early 70s, 33% of Americans described their lives as very happy, 52% as pretty happy, and 15% as not too happy. • By the late 2000s, the numbers were 31%, 55%, 14%.
A few years ago Economists started thinking harder about all this.
Stiglitz Report 2009 www.stiglitz-sen-fitoussi.fr
The Stiglitz Commission Report • advocates a shift of emphasis from a “production-oriented” measurement system … toward broader measures of social progress.
“Emphasis on growth is misguided” “Beyond GDP” “Measuring what matters”
Happiness is the new GDP Smile, and the economy smiles with you. Factory workers in Macedonia.
Stiglitz et al: Official statistics should blend objective and subjective well-being data Recommendation 10: Measures of both objective and subjective well-being provide key information about people’s quality of life. Statistical offices should incorporate questions to capture people’s life evaluations, hedonic experiences and priorities in their own survey.
We are constrained by human nature: Easterlin argued: u = u(y, others’ y)
But is it right to believe that humans are deeply concerned with relative position?
It has been found that Relative-income variables show up consistently in well-being equations. Blanchflower-Oswald, Journal of Public Economics 2004 Luttmer, Quarterly Journal of Economics 2005 GDA Brown et al, Industrial Relations 2008
Possibilities • Peer group/people like me • Others in the same household • Spouse/partner • Myself in the past • Friends • Neighbours • Work colleagues • “Expectations”
Clark and Oswald (JPubEcon 1996). BHPS Data on 5000 Employees Log income (y) -0.02 0.11 -0.001 (0.039) (0.050) (0.04) Log comparison income (y*) --- -0.20 --- (0.062) Log NES comparison income (y**) --- --- -0.26 (0.073) “Comparison Income” predicted from a Mincer Earnings equation (note: requires exclusion restrictions to avoid multicollinearity); “NES comparison income” matched in from another data set by hours of work, and thus avoids identification problems (but assumes reference group defined by hours of work).
From Andrew Clark’s work: Wave 3 of the European Social Survey (22 countries).
In the Netherlands and in Switzerland, people seem to do less comparing-against-others.
Clark and colleagues use new geo-referenced data, based on a geographical grid of size 100*100 meters (i.e. 10 000 square meters, or a hectare) covering the entire country. Economic Journal, 2009.
Some of these grid cells are uninhabited, others are only very thinly inhabited: around two-thirds of inhabited hectare cells contain under five households. • Data confidentiality: Statistics Denmark aggregates to produce clusters of neighbouring hectare cells with a minimum of 150 (600) households. • Contiguous • Homogenous in terms of type and ownership of housing (don’t mix flats and houses).
Figure 1 Small neighbourhoods in the area of Taastrupgård, Høje Tåstrup Source: Damm and Schultz-Nielsen (2008).
Economic Satisfaction, Income and Rank within Small Neighbourhoods: Panel Results
People like having a rich neighbourhood…and being on top of the ‘rank’ pile.
“Dark contrasts: The paradox of high rates of suicide in happy places” Daly et al JEBO 2011
Suicide dropped in NY after 9-11 “Effect of 11 September 2001 terrorist attacks in the USA on suicide in areas surrounding the crash sites” CynthiaClaassen et al BRITISH JOURNAL OF PSYCHIATRY, May 2010 Results: Around the World Trade Center, post-attack 180-day suicide rates dropped significantly (t=2.4, P=0.0046).
Overall, in humans ‘Relativity’ effects seem strong – and not just in incomes.
So what? Why might it matter to social scientists if utility depends on relative things?
Some results from: Easterlin, R. A. (2005). “Diminishing Marginal Utility of Income? Caveat Emptor”. Social Indicators Research. pp. 243-255.
This is of interest to us today –it deals with the case of Japan. Japan was a poor country in the 1950s/early 1960s, but then experienced unprecedented growth.
The blue lines show the estimated relationship between income and happiness Fact 1. Richer countries are happier countries. Japan Japan was in the middle of the income distribution in the early 1960s, and had a middling level of happiness
Look at annual indices (1962=100) of life satisfaction and real GNP per capita for Japan, 1958-1987.
Between 1962 and 1987 Japan experienced unprecedented economic growth, with GNP per capita (in real terms)rising 3.5-fold: growing from 22 to 77 percent of the United States level in 1962 We might then imagine that Japan would follow the blue lines above: as Japan became richer, it would become happier.
In fact, happiness remained constant despite Japan’s remarkable growth What “should” have happened What did happen