The Colorado River Basin: Water Stress & Sustainability
770 likes | 822 Vues
Explore the challenges facing the Colorado River Basin due to overuse and drought, impacting water supply for millions. Learn about groundwater depletion and the need for sustainable water management.

The Colorado River Basin: Water Stress & Sustainability
E N D
Presentation Transcript
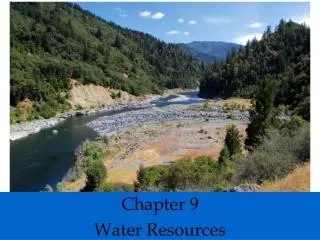
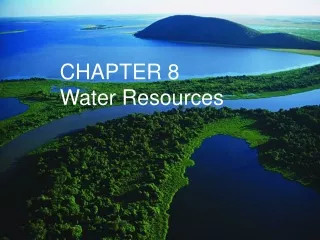
Chapter 13 Water Resources
The Colorado River Basin Fig. 13-1, p. 317
Case Study: The Colorado River Basin— An Overtapped Resource (1) • 2,300 km through 7 U.S. states • 14 Dams and reservoirs • Located in a desert area within the rain shadow of the Rocky Mountains • Water supplied mostly from snowmelt of the Rocky Mountains
Case Study: The Colorado River Basin— An Overtapped Resource (2) • Supplies water and electricity for about 30 million people • Las Vegas, Los Angeles, San Diego • Irrigation of crops that help feed America • Very little water reaches the Gulf of California • Southwest experiencing recent droughts
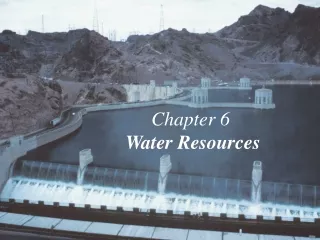
Aerial View of Glen Canyon Dam Across the Colorado River and Lake Powell Fig. 13-2, p. 317
13-1 Will We Have Enough Usable Water? • Concept 13-1A We are using available freshwater unsustainably by wasting it, polluting it, and charging too little for this irreplaceable natural resource. • Concept 13-1B One of every six people does not have sufficient access to clean water, and this situation will almost certainly get worse.
Freshwater Is an Irreplaceable Resource That We Are Managing Poorly (1) • Why is water so important? • Earth as a watery world: 71% of surface • Poorly managed resource • Water waste • Water pollution
Girl Carrying Well Water over Dried Out Earth during a Severe Drought in India Fig. 13-3, p. 319
Most of the Earth’s Freshwater Is Not Available to Us • Freshwater availability: 0.024% • Groundwater, lakes, rivers, streams • Hydrologic cycle • Movement of water in the seas, land, and air • Driven by solar energy and gravity • People divided into • Water haves • Water have-nots
Groundwater and Surface Water Are Critical Resources (1) • Zone of saturation • Spaces in soil are filled with water • Water table • Top of zone of saturation • Aquifers • Natural recharge
Groundwater and Surface Water Are Critical Resources (2) • Surface Water • Surface runoff • Watershed (drainage) basin
We Use Much of the World’s Reliable Runoff • 2/3 of the surface runoff: lost by seasonal floods • 1/3 is reliable runoff = usable
Science Focus: Water Footprints and Virtual Water (1) • Water footprint • Volume of water we directly and indirectly • Average American uses 260 liters per day • Flushing toilets, 27% • Washing clothes, 22% • Taking showers, 17% • Running faucets, 16% • Wasted from leaks, 14% • World’s poorest use 19 liters per day
Science Focus: Water Footprints and Virtual Water (2) • More water is used indirectly = virtual water • Hamburger, 2400 liters • Virtual water often exported/imported • Grains and other foods
1 tub = 151 liters (40 gallons) = 1 tub = 4 tubs = 16 tubs = 17 tubs = 72 tubs = 2,600 tubs = 16,600 tubs Fig. 13-A, p. 321
Case Study: Freshwater Resources in the United States • More than enough renewable freshwater, unevenly distributed and polluted • Effect of • Floods • Pollution • Drought
Average Annual Precipitation and Major Rivers, Water-Deficit Regions in U.S. Fig. 13-4, p. 322
Average annual precipitation (centimeters) Less than 41 81–122 41–81 More than 122 Acute shortage Shortage Adequate supply Metropolitan regions with population greater than 1 million Fig. 13-4, p. 322
Washington North Dakota Montana Oregon Idaho South Dakota Wyoming Nebraska Nevada Utah Kansas Colorado California Oklahoma New Mexico Arizona Texas Highly likely conflict potential Substantial conflict potential Moderate conflict potential Unmet rural water needs Fig. 13-5, p. 322
Water Shortages Will Grow (1) • Dry climates • Drought • Too many people using a normal supply of water • Wasteful use of water
Water Shortages Will Grow (2) • China and urbanization • 30% earth’s land area experiences severe drought • Will rise to 45% by 2059 from climate change • Potential conflicts/wars over water • Refugees from arid lands • Increased mortality
Natural Capital Degradation: Stress on the World’s Major River Basins Fig. 13-6, p. 323
13-2 Is Extracting Groundwater the Answer? • Concept 13-2 Groundwater used to supply cities and grow food is being pumped from aquifers in some areas faster than it is renewed by precipitation.
Groundwater is Being Withdrawn Faster Than It Is Replenished (1) • Most aquifers are renewable • Aquifers provide drinking water for half the world • Water tables are falling in many parts of the world, primarily from crop irrigation
Trade-Offs Withdrawing Groundwater Advantages Disadvantages Useful for drinking and irrigation Aquifer depletion from overpumping Sinking of land (subsidence) from overpumping Exists almost everywhere Renewable if not overpumped or contaminated Pollution of aquifers lasts decades or centuries Cheaper to extract than most surface waters Deeper wells are nonrenewable Fig. 13-7, p. 325
Case Study: Aquifer Depletion in the United States • Ogallala aquifer: largest known aquifer • Irrigates the Great Plains • Very slow recharge • Water table dropping • Government subsidies to continue farming deplete the aquifer further • Biodiversity threatened in some areas • California Central Valley: serious water depletion
Natural Capital Degradation: Areas of Greatest Aquifer Depletion in the U.S. Fig. 13-9, p. 326
Groundwater Overdrafts: High Moderate Minor or none Fig. 13-9, p. 326
Overpumping Aquifers Has Several Harmful Effects • Limits future food production • Bigger gap between the rich and the poor • Land subsidence • Mexico City • San Joaquin Valley in California • Groundwater overdrafts near coastal regions • Contamination of groundwater with saltwater
Subsidence in the San Joaquin Valley Fig. 13-11, p. 327
Solutions: Groundwater Depletion, Prevention and Control Fig. 13-12, p. 327
13-3 Is Building More Dams the Answer? • Concept 13-3 Building dam-and-reservoir systems has greatly increased water supplies in some areas, but it has disrupted ecosystems and displaced people.
Large Dams and Reservoirs Have Advantages and Disadvantages (1) • Main goal of a dam and reservoir system • Capture and store runoff • Release runoff as needed to control: • Floods • Generate electricity • Supply irrigation water • Recreation (reservoirs)
Large Dams and Reservoirs Have Advantages and Disadvantages (2) • Advantages • Increase the reliable runoff available • Reduce flooding • Grow crops in arid regions • Disadvantages • Displaces people • Flooded regions • Loss of plant and animal species • Fill up with sediment • Can cause other streams and lakes to dry up
Advantages and Disadvantages of Large Dams and Reservoirs Fig. 13-13, p. 328
Provides irrigation water above and below dam Flooded land destroys forests or cropland and displaces people Large losses of water through evaporation Provides water for drinking Deprives downstream cropland and estuaries of nutrient-rich silt Reservoir useful for recreation and fishing Risk of failure and devastating downstream flooding Can produce cheap electricity (hydropower) Reduces down-stream flooding of cities and farms Disrupts migration and spawning of some fish Fig. 13-13a, p. 328
Powerlines Reservoir Dam Powerhouse Intake Turbine Fig. 13-13b, p. 328
A Closer Look at the Overtapped Colorado River Basin (1) • Only small amount of Colorado River water reaches Gulf of California • Threatens aquatic species in river and species that live in the estuary • Current rate of river withdrawal is not sustainable • Much water used for agriculture that is inefficient with water use: cotton, alfalfa, rice • Water use subsidized by government
A Closer Look at the Overtapped Colorado River Basin (2) • Reservoirs • Leak water into ground below • Lose much water through evaporation • Fill up with silt load of river, depriving delta • Could eventually lose ability to store water and create electricity • States must conserve water, control population, and slow urban development
13-4 Is Transferring Water from One Place to Another the Answer? • Concept 13-4 Transferring water from one place to another has greatly increased water supplies in some areas, but it has also disrupted ecosystems.
California Transfers Water from Water-Rich Areas to Water-Poor Areas • Water transferred from north to south by • Tunnels • Aqueducts • Underground pipes • California Water Project • Inefficient water use • Environmental damage to Sacramento River and San Francisco Bay
Southern California Lettuce Grown with Northern California Water Fig. 13-15, p. 331
The California Water Project and the Central Arizona Project Fig. 13-16, p. 331
CALIFORNIA NEVADA Shasta Lake Oroville Dam and UTAH Sacramento River Reservoir Feather River Lake Tahoe North Bay Aqueduct Sacramento SIERRA MOUNTAIN RANGE San Francisco South Bay Aqueduct Hoover Dam and Reservoir (Lake Mead) Fresno San Luis Dam and Reservoir San Joaquin Valley Colorado River Los Angeles Aqueduct California Aqueduct ARIZONA Colorado River Aqueduct Santa Barbara Central Arizona Project Los Angeles Phoenix Salton Sea San Diego Tucson MEXICO Fig. 13-16, p. 331
Natural Capital Degradation: The Aral Sea, Shrinking Freshwater Lake Fig. 13-17, p. 332
Case Study: The Aral Sea Disaster (2) • Wind-blown salt • Water pollution • Restoration efforts • Cooperation of neighboring countries • More efficient irrigation • Dike built to raise lake level
13-5 Is Converting Salty Seawater to Freshwater the Answer? • Concept 13-5 We can convert salty ocean water to freshwater, but the cost is high, and the resulting salty brine must be disposed of without harming aquatic or terrestrial ecosystems.
Removing Salt from Seawater Is Costly, Kills Organisms, Creates Briny Wastewater (1) • Desalination • Removing dissolved salts • Distillation: evaporate water, leaving salts behind • Reverse osmosis, microfiltration: use high pressure to remove salts • 14,450 plants in 125 countries • Saudi Arabia: highest number
Removing Salt from Seawater Is Costly, Kills Organisms, Creates Briny Wastewater (2) • Problems • High cost and energy footprint • Keeps down algal growth and kills many marine organisms • Large quantity of brine wastes
Science Focus: The Search for Improved Desalination Technology • Desalination on offshore ships • Solar or wind energy • Use ocean waves for power • Build desalination plants near electric power plants