Download
1 / 16
160 likes | 162 Vues
60 people with disease. 40 people without disease. Total population = 100. IDEAL!. True positive. +. True negative. -. True negative tests = 40. True positive tests = 60. True positive. +. True negative. -. True positive tests = 48. True negative tests = 40.

E N D
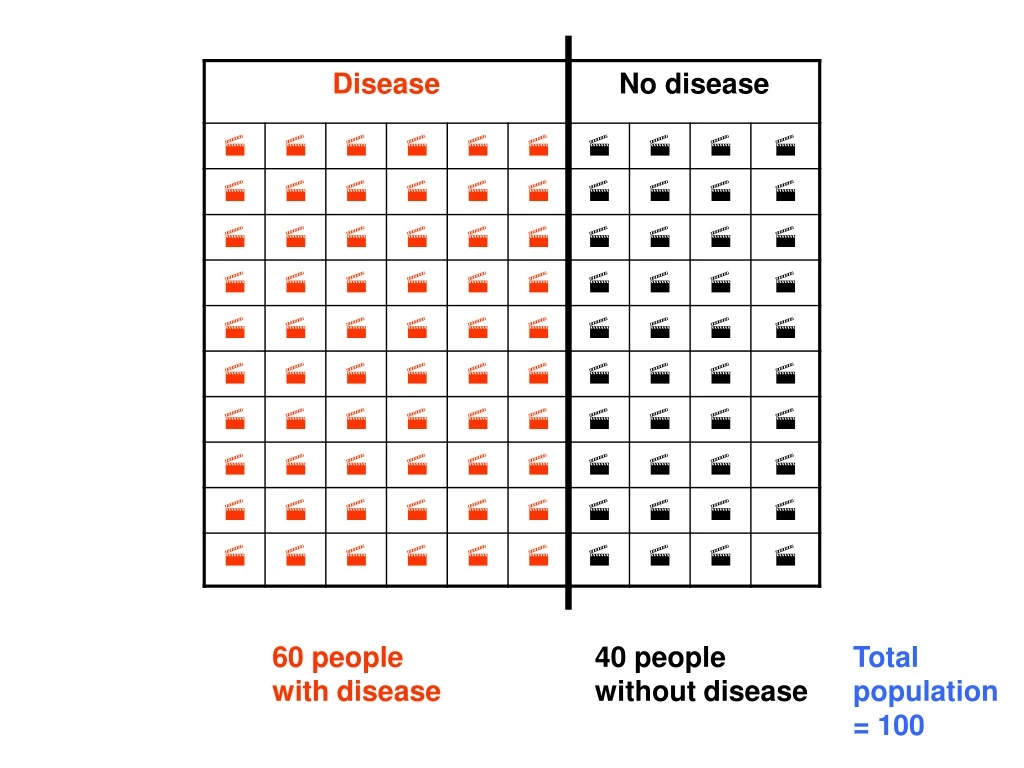
60 people with disease 40 people without disease Total population = 100
IDEAL! True positive + True negative - True negative tests = 40 True positive tests = 60
True positive + True negative - True positive tests = 48 True negative tests = 40 All the positive tests show disease, even though some cases are missed
False positive True positive + - True positive tests = 48 False positive tests = 12 True negative tests = 40
False positive True positive + - True negative False negative + - Positive tests = 48 + 12 = 60 Negative tests = 28 + 12 = 40 True positive tests = 48 False positive tests = 12 False negative tests = 12 True negative tests = 40
False positive = 12 True positive = 48 True negative = 28 False negative = 12 + + - Positive tests = true positive + false positive - + Negative tests = true negative + false negative +
Positive and negative predictive value Disease present Disease absent Test positive True positive False positive TP + FP Test negative False negative True negative FN + TN Positive predictive value = TP/(TP + FP) Negative predictive value = TN/(FN + TN)
Positive and negative predictive value Disease present Disease absent Test positive 48 60 12 Test negative 12 28 40 Positive predictive value = 48/60 = 80% Negative predictive value = 28/40 = 70%
Positive predictive value • PPV is the proportion of positive tests that actually show disease • PPV = 48/60 = 80% • For every 100 positive test results, 80 will be true positive and 20 will be false positive
Negative predictive value • NPV is the proportion of negative tests that show no disease • NPV = 28/40 = 70% • For every 100 negative test results, 70 will be true negative and 30 will be false positive
New situations • What does a PPV of 85% mean? For every 100 positive tests in patients from a similar population how many would be true positives? • Answer: N = 85
New situations • A positive test result usually means that a patient will have treatment or a further test. • In an asthma clinic a positive test is followed by corticosteroid treatment. If there are 20 positive tests and a PPV of 75%, how many patients would be given corticosteroids unnecessarily? • Answer: N = 5
New situations • The NPV for the same test in the same clinic is 90%. For every 20 patients who test negative, how many will be false negative? • Answer: N = 2
Positive and negative predictive value Disease present Disease absent Test positive 44 50 6 Test negative 3 27 30 Positive predictive value = 44/50 = 88% Negative predictive value = 27/30 = 90% How many patients would be given treatment unnecessarily? N = 6