Mixed Effects and Group Modeling for fMRI Data
400 likes | 432 Vues
Explore mixed effects methods in fMRI data analysis, including motivations, evaluation, and approaches such as summary statistic and SPM8. Understand fixed vs. random effects and modeling assumptions for robust results.

Mixed Effects and Group Modeling for fMRI Data
E N D
Presentation Transcript
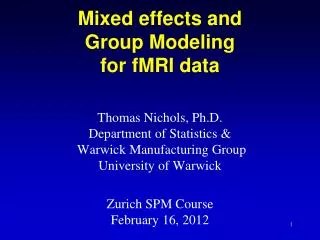
Mixed effects and Group Modelingfor fMRI data Thomas Nichols, Ph.D. Department of Statistics & Warwick Manufacturing Group University of Warwick Zurich SPM CourseFebruary 16, 2012
Outline • Mixed effects motivation • Evaluating mixed effects methods • Two methods • Summary statistic approach (HF) (SPM96,99,2,5,8) • SPM8 Nonsphericity Modelling • Data exploration • Conclusions
Overview • Mixed effects motivation • Evaluating mixed effects methods • Two methods • Summary statistic approach (HF) (SPM96,99,2,5,8) • SPM8 Nonsphericity Modelling • Data exploration • Conclusions
Lexicon Hierarchical Models • Mixed Effects Models • Random Effects (RFX) Models • Components of Variance ... all the same ... all alluding to multiple sources of variation (in contrast to fixed effects)
Distribution of each subject’s estimated effect Fixed vs.RandomEffects in fMRI 2FFX Subj. 1 Subj. 2 • Fixed Effects • Intra-subject variation suggests all these subjects different from zero • Random Effects • Intersubject variation suggests population not very different from zero Subj. 3 Subj. 4 Subj. 5 Subj. 6 0 2RFX Distribution of population effect
Fixed Effects • Only variation (over sessions) is measurement error • True Response magnitude is fixed
Random/Mixed Effects • Two sources of variation • Measurement error • Response magnitude • Response magnitude is random • Each subject/session has random magnitude
Random/Mixed Effects • Two sources of variation • Measurement error • Response magnitude • Response magnitude is random • Each subject/session has random magnitude • But note, population mean magnitude is fixed
Fixed vs. Random • Fixed isn’t “wrong,” just usually isn’t of interest • Fixed Effects Inference • “I can see this effect in this cohort” • Random Effects Inference • “If I were to sample a new cohort from the population I would get the same result”
Two Different Fixed Effects Approaches • Grand GLM approach • Model all subjects at once • Good: Mondo DF • Good: Can simplify modeling • Bad: Assumes common variance over subjects at each voxel • Bad: Huge amount of data
Two Different Fixed Effects Approaches • Meta Analysis approach • Model each subject individually • Combine set of T statistics • mean(T)n ~ N(0,1) • sum(-logP) ~ 2n • Good: Doesn’t assume common variance • Bad: Not implemented in software Hard to interrogate statistic maps
Overview • Mixed effects motivation • Evaluating mixed effects methods • Two methods • Summary statistic approach (HF) (SPM96,99,2,5,8) • SPM8 Nonsphericity Modelling • Data exploration • Conclusions
Assessing RFX ModelsIssues to Consider • Assumptions & Limitations • What must I assume? • Independence? • “Nonsphericity”? (aka independence + homogeneous var.) • When can I use it • Efficiency & Power • How sensitive is it? • Validity & Robustness • Can I trust the P-values? • Are the standard errors correct? • If assumptions off, things still OK?
Overview • Mixed effects motivation • Evaluating mixed effects methods • Two methods • Summary statistic approach (HF) (SPM96,99,2,5,8) • SPM8 Nonsphericity Modelling • Data exploration • Conclusions
Overview • Mixed effects motivation • Evaluating mixed effects methods • Two methods • Summary statistic approach (HF) (SPM96,99,2,5,8) • SPM8 Nonsphericity Modelling • Data exploration • Conclusions
Holmes & Friston • Unweighted summary statistic approach • 1- or 2-sample t test on contrast images • Intrasubject variance images not used (c.f. FSL) • Proceedure • Fit GLM for each subject i • Compute cbi, contrast estimate • Analyze {cbi}i
^ 1 ^ ^ 2 ^ ^ 3 ^ ^ 4 ^ ^ 5 ^ ^ 6 ^ Holmes & Fristonmotivation... estimated mean activation image Fixed effects... p < 0.001 (uncorrected) — ^ •– c.f. 2 / nw SPM{t} – c.f. n – subjects w – error DF p < 0.05 (corrected) ...powerful but wrong inference SPM{t}
^ 1 ^ ^ 2 ^ ^ 3 ^ ^ 4 ^ ^ 5 ^ ^ 6 ^ Holmes & FristonRandom Effects level-one(within-subject) level-two(between-subject) an estimate of the mixed-effects model variance 2+2/w ^ variance 2 (no voxels significant at p < 0.05 (corrected)) — ^ •– c.f. 2/n = 2 /n + 2 / nw – c.f. p < 0.001 (uncorrected) SPM{t} contrast images timecourses at [ 03, -78, 00 ]
Holmes & FristonAssumptions • Distribution • Normality • Independent subjects • Homogeneous Variance • Intrasubject variance homogeneous • 2FFX same for all subjects • Balanced designs
Holmes & FristonLimitations • Limitations • Only single image per subject • If 2 or more conditions,Must run separate model for each contrast • Limitation a strength! • No sphericity assumption made on different conditions when each is fit with separate model
Holmes & FristonEfficiency • If assumptions true • Optimal, fully efficient • If 2FFX differs between subjects • Reduced efficiency • Here, optimal requires down-weighting the 3 highly variable subjects 0
Holmes & FristonValidity • If assumptions true • Exact P-values • If 2FFX differs btw subj. • Standard errors not OK • Est. of 2RFX may be biased • DF not OK • Here, 3 Ss dominate • DF < 5 = 6-1 0 2RFX
Holmes & FristonRobustness • In practice, Validity & Efficiency are excellent • For one sample case, HF almost impossible to break • 2-sample & correlation might give trouble • Dramatic imbalance or heteroscedasticity • False Positive Rate • Power Relative to Optimal • (outlier severity) • (outlier severity) • Mumford & Nichols. Simple group fMRI modeling and inference. Neuroimage, 47(4):1469--1475, 2009.
Overview • Mixed effects motivation • Evaluating mixed effects methods • Two methods • Summary statistic approach (HF) (SPM96,99,2,5,8) • SPM8 Nonsphericity Modelling • Data exploration • Conclusions
SPM8 Nonsphericity Modelling • 1 effect per subject • Uses Holmes & Friston approach • >1 effect per subject • Can’t use HF; must use SPM8 Nonsphericity Modelling • Variance basis function approach used...
12 subjects,4 conditions Use F-test to find differences btw conditions Standard Assumptions Identical distn Independence “Sphericity”... but here not realistic! SPM8 Notation: iid case Cor(ε) = λ I y = X + e N 1 N pp 1 N 1 X Error covariance N N
12 subjects, 4 conditions Measurements btw subjects uncorrelated Measurements w/in subjects correlated Multiple Variance Components Cor(ε) =ΣkλkQk y = X + e N 1 N pp 1 N 1 Error covariance N N Errors can now have different variances and there can be correlations Allows for ‘nonsphericity’
Errors are not independent and not identical Non-Sphericity Modeling Error Covariance Qk’s:
Errors are independent but not identical Eg. Two Sample T Two basis elements Error Covariance Non-Sphericity Modeling Qk’s:
SPM8 Nonsphericity Modelling • Assumptions & Limitations • assumed to globallyhomogeneous • lk’s only estimated from voxels with large F • Most realistically, Cor(e) spatially heterogeneous • Intrasubject variance assumed homogeneous Cor(ε) =ΣkλkQk
SPM8 Nonsphericity Modelling • Efficiency & Power • If assumptions true, fully efficient • Validity & Robustness • P-values could be wrong (over or under) if local Cor(e) very different from globally assumed • Stronger assumptions than Holmes & Friston
Overview • Mixed effects motivation • Evaluating mixed effects methods • Two methods • Summary statistic approach (HF) (SPM96,99,2,5,8) • SPM8 Nonsphericity Modelling • Data exploration • Conclusions
Data: FIAC Data • Acquisition • 3 TE Bruker Magnet • For each subject:2 (block design) sessions, 195 EPI images each • TR=2.5s, TE=35ms, 646430 volumes, 334mm vx. • Experiment (Block Design only) • Passive sentence listening • 22 Factorial Design • Sentence Effect: Same sentence repeated vs different • Speaker Effect: Same speaker vs. different • Analysis • Slice time correction, motion correction, sptl. norm. • 555 mm FWHM Gaussian smoothing • Box-car convolved w/ canonical HRF • Drift fit with DCT, 1/128Hz
Look at the Data! • With small n, really can do it! • Start with anatomical • Alignment OK? • Yup • Any horrible anatomical anomalies? • Nope
Look at the Data! • Mean & Standard Deviationalso useful • Variancelowest inwhite matter • Highest around ventricles
Look at the Data! • Then the functionals • Set same intensity window for all [-10 10] • Last 6 subjects good • Some variability in occipital cortex
Feel the Void! • Compare functional with anatomical to assess extent of signal voids
Conclusions • Random Effects crucial for pop. inference • When question reduces to one contrast • HF summary statistic approach • When question requires multiple contrasts • Repeated measures modelling • Look at the data!
References for fourRFX Approaches in fMRI • Holmes & Friston (HF) • Summary Statistic approach (contrasts only) • Holmes & Friston (HBM 1998). Generalisability, Random Effects & Population Inference. NI, 7(4 (2/3)):S754, 1999. • Holmes et al. (SnPM) • Permutation inference on summary statistics • Nichols & Holmes (2001). Nonparametric Permutation Tests for Functional Neuroimaging: A Primer with Examples. HBM, 15;1-25. • Holmes, Blair, Watson & Ford (1996). Nonparametric Analysis of Statistic Images from Functional Mapping Experiments. JCBFM, 16:7-22. • Friston et al. (SPM8 Nonsphericity Modelling) • Empirical Bayesian approach • Friston et al. Classical and Bayesian inference in neuroimaging: theory. NI 16(2):465-483, 2002 • Friston et al. Classical and Bayesian inference in neuroimaging: variance component estimation in fMRI. NI: 16(2):484-512, 2002. • Beckmann et al. & Woolrich et al. (FSL3) • Summary Statistics (contrast estimates and variance) • Beckmann, Jenkinson & Smith. General Multilevel linear modeling for group analysis in fMRI. NI 20(2):1052-1063 (2003) • Woolrich, Behrens et al. Multilevel linear modeling for fMRI group analysis using Bayesian inference. NI 21:1732-1747 (2004)