Download
1 / 32
320 likes | 634 Vues
An Evaluation of Nonresponse Bias in the Resident Relocation and Making Connections Surveys. Lisa Lee & Catherine Haggerty NORC SLLS, September 2010. Nonresponse Bias. Nonresponse can bias survey estimates High response rates are not a guarantee against nonresponse bias.

E N D
An Evaluation of Nonresponse Bias in the Resident Relocation and Making Connections Surveys Lisa Lee & Catherine Haggerty NORC SLLS, September 2010
Nonresponse Bias • Nonresponse can bias survey estimates • High response rates are not a guarantee against nonresponse bias.
Nonresponse in Panel Surveys • Analyses on changes over time are conducted on the panel respondents • Characteristics of the panel may not represent those of the nonrespondents
Study of Nonresponse Bias • Examine issues of nonresponse bias in two longitudinal surveys conducted by NORC • Resident Relocation Survey • Making Connections Survey
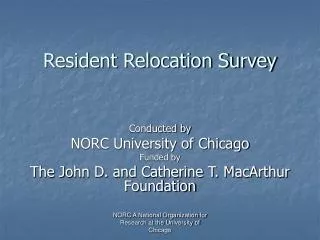
Resident Relocation Survey • Public housing leaseholders • Four rounds of interviews between 2002 and 2009 • Support from John D. and Catherine T. MacArthur Foundation
Making Connections Survey • Ten urban communities • Cross-sectional study of neighborhoods combined with a panel survey of households with children • Three waves of data collection since 2002 • Funded by the Annie E. Casey Foundation
Addressing Nonresponse Bias • Weighting • RRS data weighted to account for slightly varying response rates by public housing development and by phase • MC Wave 1 data are weighted to account for varying response rates by neighborhood and by sample frame from which cases were drawn (Zimowski, Tourangeau, Ghadialy, & Pedlow, 1997; Ellis, 1970; Smith, 1983)
Addressing Nonresponse Bias • Nonrespondent Follow-up • Conduct follow-up effort to locate and interview nonrespondents to the study • Best evidence for assessing reasons for nonresponse, presence and magnitude of nonresponse bias in a survey • However, if the surveyed nonrespondents are not representative, data will be of limited use in evaluating non-response bias Srinath, 1971; Zimowski, Tourangeau, Ghadialy, & Pedlow, 1997; Lasek, Barkely, Harper, & Rosenthal, 1997; Klein, 1981, Hill, Roberts, Ewings, & Gunnell, 1997
Impact of Relocation on Leaseholders • Concern that CHA leaseholders being relocated would experience problems • Lease compliance • Unsubsidized housing
RRS Nonrespondent Survey • Sample of 106 Wave 3 nonrespondents • 62 Wave 3 nonrespondents interviewed • 58.5% response rate
Another Approach to Assessing Nonresponse Bias • A nonresponse follow-up survey can affect budget and schedule • Is nonresponse survey necessary?
Using Respondent Data to Examine Nonresponse Bias • “Continuum of resistance” approach • No contact was primary reason for nonresponse in RRS • “Continuum of locatability” Voigt, Koepsell, & Daling, 2003; Paganini-Hill, Hsu, Chao, & Ross, 1993; Filion, 1970. But see Lin & Schaeffer, 1995; Ellis et al., 1970.
Time to Completion • Case management data on days to survey completion • Divide respondents into two groups • Fast = 25 days or less • Slow = more than 25 days
Findings from Fast vs. Slow Respondents • Nonrespondent survey provided evidence of presence and magnitude of bias • Differences in survey estimates found for Fast vs. Slow respondents (“locatability”)
Using Data Across Survey Waves to Examine Nonresponse Bias • Examining Early Characteristics of Later Nonrespondents • Characteristics of respondents in earlier waves of a survey may be related to later nonresponse. • Are nonrespondents to later surveys different from those who continue to be respondents?
RRS Wave 4 Dispositions of Wave 3 Respondents • 665 Wave 3 Respondents • 572 (86%) participated in Wave 4 • 93 (14%) did not participate in Wave 4
Differences Between RRS Wave 4 Respondents and Nonrespondents
Differences Between RRS Wave 4 Respondents and Nonrespondents
Making Connections • Examining Wave 1 Characteristics of Wave 2 Respondents and Nonrespondents • Panel sample of 2029 children • 1432 (71%) participated in Wave 2 • 597 (29%) did not participate in Wave 2 • Cross-sectional sample of 1692 adult-only households • 1468 (87%) participated in Wave 2 • 224 (13%) did not participate in Wave 2
Conclusions • Nonresponse bias can be present despite high response rates • Nonrespondent follow-up survey useful for understanding nonresponse bias • Differences between fast and slow to complete may provide clues to bias • Early characteristics of respondents may be associated with later nonresponse
Next Steps • Expand research to • Look at additional waves of data • Compare respondents and nonrespondents on additional variables • Look at additional paradata
Contact Information lee-lisa@norc.org haggerty@norc.uchicago.edu