Download
1 / 65
650 likes | 805 Vues
Dividend Re-Investment Plans. Andre J. Trottier. Introduction. Individual Investor, Retired 1997 Invested from 1975-82 Canadian Moneysaver Articles Leveraging Split Shares Frictional Costs. Topics of Discussion. Frictional Costs DRIP Power of Dividends Efficiency Simplicity

E N D
DividendRe-InvestmentPlans Andre J. Trottier
Introduction • Individual Investor, Retired 1997 • Invested from 1975-82 • Canadian Moneysaver Articles • Leveraging • Split Shares • Frictional Costs
Topics of Discussion • Frictional Costs • DRIP • Power of Dividends • Efficiency • Simplicity • Getting Started
Taxes, Loads & Fees • Most certain components • Negative components • Effective management will do most to enhance returns • Goal be avoiding them…..No • Do they really matter?….Yes
Taxes • Ontario $30,754, MTR 28.16% • Tax Factor = 1.00 = 1.39 1.00 - 0.2816 (MTR) • Earn $1.39 to keep $1.00 • 18.9% VISA = 18.9 X 1.39 or 26.27%
Federal Personal Tax Rates • $30,754 or Less----------16% • $30,754 to $61,508------22% • $61,629 to $100,00------26% • $100,000+------------------29%
Tax Avoidance Strategies • Defer income • Arrange income to be Tax Efficient • Capital gains & dividends • Interest instruments in RSP
Management Expense Ratios (MERs) • Canadian average 2.50% • Was 2.30% in 1997 • US Average 1.35%
Rule of 40 • Take 40 and divide it by the MER • number of years to consume 1/3 of your investment • 40 / 2.5% = 16 yrs • front end load of 33%
Your Mutual Fund Manager Really Charging You? • True Cost per $100,000.00 invested • MER 10 yrs 20 yrs 30 yrs • 1.0% $9,250 $18,130 $25,950 • 1.5% $13,930 $25,920 $36,240 • 2.0% $18,130 $32,970 $45,120 • 3.0% $25,920 $45,120 $59,340 • Fee Impact calculator http://strategis.ic.gc.ca
Diminishing Returns • 1993 43 Top Quartile Mgrs • 1994 14 out the 43 • 1995 5 out the 43 • 1996 2 out the 43 • 1997 0 out the 43
Mutual Fund Facts • “Outperformance” will "Regress to the Mean" • the 1990s 80% of Canadian Funds"Did not beat the averages" • Efficient investing: • Never pay >2% commission, total • Funds charge 2.5%/yr
Tradex Equity Fund • -open only to public servants • -since 1961, avg 11% return/yr • -Philips Hager & North • - Globefund top 15 funds for 15 year performance • -"lucky to be a Public Servant“ • Reason 1.35% MER
John Bogle • The easiest and surest way for a fund to achieve the top quartile in investment performance among peer funds is to achieve the bottom quartile in expenses.
Nortel Employee • BMO Funds 1.5% MER • YearAmount1.5% FeeDirect • 2001 $120,000 $1,800 $120,000 • 2010 $332,769 $4,991 $375,079 • 2020 $1,033,531 $15,502 $1,330,768 • 2027 $2,284,806 $34,272 $3,229,041
A. Trottier’s Situation • AGF American Growth 2.88% • AIC Advantage 2 2.72% • AGF International Stock Class 2.85% • Fidelity Focus Health Care 2.68%
2.80% MER Chart • YearAmount2.8% FeeDirect • 2001 $120,000 $3,360 $120,000 • 2010 $299,577 $8,388 $375,097 • 2020 $827,915 $23,181 $1,330,768 • 2027 $1,706,435 $47,780 $3,229,041 • 2027 $2,284,806 $34,272 $3,229,041
Fund Problems • To equal TSE 300, must beat it by 2.5% to be equal • Cash position earns low returns • Transaction costs • Manager focused on “Performance”
Tax Efficiency • Capital Gains distributed to holders • Holders pay the tax • No control, just tax liability • Unrealized Capital Gains • i. e. MSFT on original IPO • AIC Advantage BRK.A at $3500 • 4th Qtr purchase = year’s liability
Don’t Worry • No big deal, you don’t have to worry about risking your life savings, “We do that for you.”
Gold, Frankincense and MER • Most certain aspect • Distinctly “negative” aspect • Effective mgmt=enhanced returns • Do Loads & Fees matter? • ABSOLUTELY
The Money Machine How the mutual fund Industry worksDaniel Stoffman • Page 220 • Should I buy individual stocks as well as, or instead of mutual funds? • If you've read this far, you've probably figured this out for yourself.
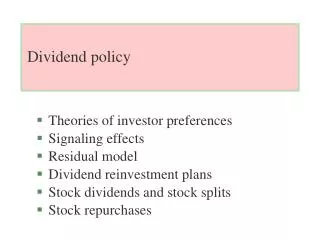
DRIP Defined • Dividends are not paid to holder • Money buys additional shares • Additional shares yield dividend • These dividends create additional shares • Thus the Dividend Effect
Dividend Effect • dividend growth - 4% annually • YearDividend • 1$5.50 • 2$5.72 • 5$6.43 • 10$7.83 • 12 $8.47
Effect of Increasing Dividends • Year Price (8%) Dividend (4%) Yield on Cost 1 $10.00 0.25 2.50 % 5 $14.64 0.30 3.04 % 10 $21.59 0.37 3.70 % 25 $68.48 0.66 6.66 %
Dividends &Capital Growth • 1952, farmer retired with $100,000 • Invested in CSBs • 1983 son “What if BMO in 52” • BMO, 3400 shares in 1952 • 1983, with splits 17,000 shares worth $456,875 • Ignoring Dividends of $410,993
Dividends &Capital Growth • Barron’s Article April 1999 • $100 invested in S&P 500 in 1925 • 1999 would be $9,600 • With DRIP $235,000
The 5% DRIP Advantage • Some cos offer a 5% discount on DRIPs and OCP • netstockdirect.com-115 US cos • Canadian Companies • MDS & W (5% on DRIPS) • TD (2.5% on DRIPs) • TA (5% on DRIPs & OCP)
Cdn Cos Paying Dividends Shrinking • 1981 - 100 cos • 1991 - 80 cos • 2000 - 60 cos • 2001 - 57 cos