Download
1 / 17
170 likes | 277 Vues
This report provides a comprehensive overview of the Manhattan office market as of the third quarter of 2001, highlighting the significant impact of the September 11th attacks. Key metrics include available square footage, overall vacancy rates, and leasing activity, comparing direct and sublease space. The report also examines the immediate economic effects, such as job losses and reductions in tourism revenue, along with the long-term implications for New York City's economy and office space inventory.

E N D
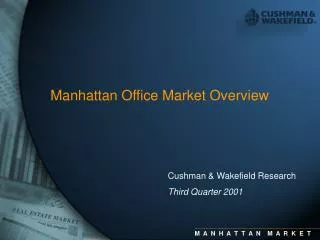
Manhattan Office Market Overview Cushman & Wakefield Research Third Quarter 2001
Manhattan Office Market Sublease available square feet (in millions) Source: Cushman & Wakefield Research
Third Quarter LeasingActivity Direct vs. Sublease SquareFeet Source: Cushman & Wakefield Research
The Impact of September 11th Cushman & Wakefield Research
Available Space As of 09/01/01 Overall Available (Sq. Ft.) Overall Vacancy Rate Number of Built Buildings Inventory (Rentable Sq. Ft.) 225,022,113 107.908,924 62,514,739 395,346,776 Midtown Downtown Midtown South Manhattan 799 237 416 1,452 15,879,861 6,369,865 5,479,422 27,729,148 7.1% 5.9% 8.8% 7.0% Source: Cushman & Wakefield Research
Impact on Inventory - 9/11/01 Damaged Building SF One World Financial Center 1.4 Three World Financial Center 2.3 Two World Financial Center 2.2 130 Liberty 1.4 90 West Street .33 Destroyed Building SF World Trade Center One 4.4 World Trade Center Two 4.4 World Trade Center Four .51 World Trade Center Five .63 World Trade Center Six .54 World Trade Center Seven 1.9 Source: Cushman & Wakefield Research
Additions/Deletions to the Market Source: CoStar Group; Cushman & Wakefield Research
Space Added 9/12 - 10/12 Source: Cushman & Wakefield Research
Available Space As of 09/30/01 Overall Available (Sq. Ft.) Overall Vacancy Rate Number of Built Buildings Inventory (Rentable Sq. Ft.) 226,847,764 96,184,539 62,514,739 385,547,042 Midtown Downtown Midtown South Manhattan 800 231 416 1,447 17,853,216 6,146,772 5,452,359 29,452,279 7.9% 6.4% 8.7% 7.6% Source: Cushman & Wakefield Research
Space Availabilities through the NYC Region Source: Cushman & Wakefield Research
Potential Relocation Preferences Completed and Pending Transactions Source: Cushman & Wakefield Research
Available Space Based on Current Activity Overall Available (Sq. Ft.) Overall Vacancy Rate Number of Built Buildings Inventory (Rentable Sq. Ft.) 226,847,764 96,184,539 62,514,739 385,547,042 Midtown Downtown Midtown South Manhattan 800 231 416 1,447 13,494,839 4,837,722 4,663,231 22,995,792 5.9% 5.0% 7.5% 6.0% Source: Cushman & Wakefield Research
Impact on Tourism Estimated Visitor Spending Loss: $237.2 million (9/11-9/29) • Hotels Estimated Losses: $6-10 million/daily (as of 9/21) Occupancy Rates averaging 50% compared to 89.5% in September 2000 4,000 job losses • Restaurants Losing $20 million daily (as of 9/21) • Broadway 80% decline in ticket sales week of 9/11, representing a $3 - 5 million loss Four shows closed; several others in jeopardy Ticket sales have now stabilized Sources: PFK Hospitality Consulting, New York Restaurant Association, League of American Theaters & Producers, NYC & Company
Impact on the Economy Short-term (Immediate days following and up to 1 year) • 370,000 jobs affected south of Canal St, mainly FIRE and retail trade • 50,000 employees displaced in the WTC, WFC and immediate vicinity • Direct loss in Gross City Product (GCP) estimated at $8 billion through the end of September Long-term and Permanent effects • 17,000 jobs permanently lost due to relocation or elimination, mostly in FIRE sector, securities subsector • 23,000 job losses in tourism-related industries in 2001 and 2002. • Indirect job losses, mainly in service and trade, could amount to 40,000 • Total output (real GCP) lost could be as high as $30-40 billion in 2002 and 2003 • Including a U.S. recession and local multiplier effects, total private sector job losses could amount to 115,000 in 2002 • Wage income loss: $12 Billion in 2002 • Significant tax revenue loss Source; New York City Office of Management and Budget
Private Sector Employment Forecast Thousands of Jobs Source: NYC Office of Management of Budget
FIRE Sector Employment Forecast Thousands of Jobs Source: NYC Office of Management of Budget
Services Sector Employment Forecast Thousands of Jobs Source: NYC Office of Management of Budget