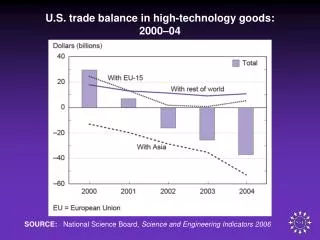
Enhancements in Ocean Color Data Processing through Cloud Cover and Ocean Area Searches
This study addresses the challenge of cloud cover interference in ocean color data acquisition, crucial for observing regional oceanic phenomena. The National Aeronautics and Space Administration (NASA) implemented cloud cover and ocean area searching attributes to improve data quality from SeaWiFS high-resolution images. Using a Simple, Scalable, Script-Based Science Processor (S4P), the research computed ocean and cloud cover percentages from archived data, facilitating enhanced data selection for researchers. The development of cloud cover histograms aids users in discerning data quality during searches.

Enhancements in Ocean Color Data Processing through Cloud Cover and Ocean Area Searches
E N D
Presentation Transcript
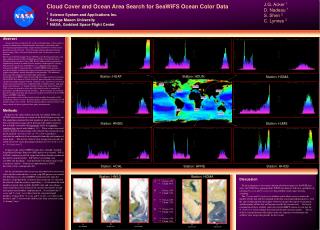
HUAF HDUN HJMS HNSG HOMA HPRE HCHL HHOB A Ocean: 18% Cloud: 91% B Ocean: 35% Cloud: 73% C Ocean: 66% Cloud: 75% D Ocean: 21% Cloud: 43% E Ocean: 43% Cloud: 30% J.G. Acker 1 D. Nadeau 1 S. Shen 2 C. Lynnes 3 Cloud Cover and Ocean Area Search for SeaWiFS Ocean Color Data 1 Science System and Applications Inc. 2George Mason University 3 NASA, Goddard Space Flight Center Abstract: Ocean color data is acquired in the visual wavelength range, so data quality is obviously influenced by cloud obscuration. Researchers, particularly those investigating regional phenomena, require minimal cloud cover so that oceanic phenomena can be observed. Data "browsing" utilizing reduced-resolution browse images allows selection of high-quality data, but this process can be laborious. The Ocean Color Data Support Team (OCDST) at the National Aeronautics and Space Administration (NASA) Goddard Space Flight Center Earth Sciences Distributed Active Archive Center (GES DAAC) addressed this requirement by implementing cloud cover and ocean area attribute searching on Sea-viewing Wide Field-of-view Sensor (SeaWiFS) Level 1A High Resolution Picture Transmission (HRPT) station data files. SeaWiFS HRPT station data files provide the highest resolution, but require user processing to produce Level 2 geophysical products, notably chlorophyll a concentration. The additional processing effort enhances the need for high-quality data. Archived Level 1A HRPT station data files did not contain cloud cover metadata. The SeaWiFS Data Analysis System (SeaDAS) processing code was utilized to calculate the number of pixels with the "cloud/ice" flag. Cloud cover over ocean and ocean area percentages were computed based on cloud/ice pixels, land mask pixels, and total pixels. A "Simple, Scalable, Script-based, Science Processor" (S4P) system was created to extract data files from the archive, compute the percentages, and add them to the file metadata. The percentages are calculated directly for more recent data files using new metadata received from the SeaWiFS Project for HRPT station data. These percentages can be used as search criteria to reduce the number of files examined in a browse session. To aid researchers, cloud cover histograms for 10 popular stations were created. These histograms indicate regional attribute value ranges which will allow significant data quality discrimination. Methods: To process the archived data (mission start to May 2000), the OCDST utilized analytical sections of the SeaDAS processing code. The algorithm calculated the total number of pixels in a data file, then used the processing code to determine the number of pixels that would be covered by the land mask and by the cloud/ice condition flag (pixels with albedo > 1.1). These values were used to first calculate the percentage of the data file that contained ocean pixels (termed “percent ocean” or “% ocean”) and then to calculate the number of clear ocean pixels from the total number of ocean pixels. The inverse value of clear ocean pixels provides the cloud-cover-over-ocean percentage (termed “percent cloud cover” or “% cloud cover”). To process the archived HRPT station data, a Simple, Scalable, Script-Based Science Processor (S4P) process was created. S4P is a DAAC-authored set of Perl scripts that allows flexible creation of data processing operations. S4P operates according to an assembly-line paradigm: each operation in the processing system is termed a “station”. Stations are implemented as UNIX directories with a configuration file. For the calculation of the ocean area and cloud-cover-over-ocean values for this archived data, a seven -step S4P process was created. The S4P process (1) selected HRPT station data files from the database; (2) prepared the system for data extraction; (3) extracted the data files from the archive (tape library); (4) calculated the total number of pixels, then used the SeaDAS code and raw radiance values from the Level 1A data file to calculate the number of land mask pixels and cloud/ice condition pixels; (5) calculated the % ocean and % cloud cover values from the categorized pixel numbers; (6) placed the % ocean and % cloud cover values in the database; and (7) removed the old data files from active processing (“cleaning” step). Station: HUAF Station: HDUN Station: HOMA Station: HNSG Station: HJMS Station: HCHL Station: HPRE Station: HHOB Station: HNSG Station: HOMA Discussion: To aid in the process of visual evaluation of browse images for SeaWiFS data users, the OCDST has augmented the WWW data browser with new capabilities of selecting % ocean and % cloud cover data attribute value ranges for data searching. The % ocean and % cloud cover attribute search allows users to reduce the number of files that will be examined in the data search and ordering process, with the aim of reducing both the number of browse images that require examination and the number of files that will be processed by the research user. Statistical examination of these attribute values for selected HRPT stations reveals that the % cloud cover value is higher than expected for most oceanic regions. The use of these search functions will require some user experience to determine the attribute value ranges that provide the best results. A 04/10/2000 B 04/06/1998 C 04/10/2000 D 10/27/1999 E 10/04/1999