Sea Spray Droplet Measurements in Hurricanes Fabian and Isabel: Insights and Data
This study presents critical measurements of sea spray droplets during hurricanes Fabian and Isabel, focusing on droplet concentration, size distribution, and their relationship with wind forcing. Utilizing data from the NOAA Environmental Technology Laboratory, we employ advanced droplet measurement technologies, including the Cloud Imaging Probe (CIP), to analyze droplet fall velocities and vertical transport balances in varying wind conditions. The results enhance the understanding of droplet dynamics in tropical cyclones, contributing valuable insights for climate modeling and forecasting.

Sea Spray Droplet Measurements in Hurricanes Fabian and Isabel: Insights and Data
E N D
Presentation Transcript
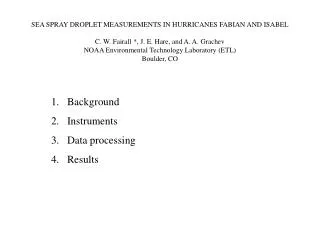
SEA SPRAY DROPLET MEASUREMENTS IN HURRICANES FABIAN AND ISABELC. W. Fairall *, J. E. Hare, and A. A. GrachevNOAA Environmental Technology Laboratory (ETL)Boulder, CO • Background • Instruments • Data processing • Results
Surface Source Strength for Sea Spray Droplets: A function of drop size and forcing
Droplet Source Strength: Deduced from or tuned to droplet concentration data Above the source region, Sn =0. Vertical transport balances fall velocity in equilibrium so constant=0 Within source region, Sn≈ Vg n
Samples from Wind Tunnel StudySPANDEX Droplet spectra profiles Droplet spectra normalized by power law equation
Surface-based droplet data, z=15 m. Droplet fall velocity as a function of size
Droplet Measurement TechnologyCloud Imaging Probe (CIP)62 size bins, 25- 1550 micron diameter
Droplet Concentration Droplet concentrations are computed from droplet counts in each size bin using the expression where U is true airspeed in cms-1, dt the sample time interval, dr the sample radius bin width (12.5 μm), and a the size-dependent sample cross-sectional area in cm2 (provided by the manufacturer).
Fall CBLAST P-3 Flights • Aug 21 Test flight --- • Sept 02 Fabian 1 9 steps 67-780 22 m/s • Sept 03 Fabian 2 8 steps 154-760 23 m/s • Sept 04 Fabian 3 5 steps 94-360 19 m/s • Sept 12 Isabel 1 10 steps 83-360 23 m/s • Sept 13 Isabel 2 9 steps 63-360 23 m/s
Data from Sept. 2 and 13 Green – median counts and blue – total counts for 10 step legs on both days (0.1 means 0).
Ntot = 0.15/m3 Mass= 0.4 to 4 10-3 g/m^3 Flux = 0.6 to 8 mm/hr
CBLAST Droplet Volume Spectra Blue and Green – CIP data; Red line – Double exponential fit; Dashed black lines FASTEX (ship) and HEXMAX (platform) for U10=22 m/s.