Understanding Data Warehousing, Decision Support, and Data Mining at UC Berkeley
This lecture review from the University of California, Berkeley, encompasses essential concepts of Data Warehousing, Decision Support Systems (DSS), and Data Mining, based on insights from experts like Joachim Hammer, Joe Hellerstein, and Mike Stonebraker. Highlighting views and view maintenance in data warehouses, the lectures touch upon various challenges in heterogeneous information sources and the importance of integrated data access for management decision-making. Key architecture concepts involving OLAP methods (ROLAP, MOLAP) and the ETL process (Extract, Transform, Load) are also discussed, providing a comprehensive overview of the domain.

Understanding Data Warehousing, Decision Support, and Data Mining at UC Berkeley
E N D
Presentation Transcript
Data Warehouses, Decision Support and Data Mining University of California, Berkeley School of Information IS 257: Database Management
Review Data Warehouses (Based on lecture notes from Joachim Hammer, University of Florida, and Joe Hellerstein and Mike Stonebraker of UCB) Views and View Maintenance Applications for Data Warehouses Decision Support Systems (DSS) OLAP (ROLAP, MOLAP) Data Mining Thanks again to lecture notes from Joachim Hammer of the University of Florida A new architecture – SAP HANA Lecture Outline
Review Data Warehouses (Based on lecture notes from Joachim Hammer, University of Florida, and Joe Hellerstein and Mike Stonebraker of UCB) Views and View Maintenance Applications for Data Warehouses Decision Support Systems (DSS) OLAP (ROLAP, MOLAP) Data Mining Thanks again to lecture notes from Joachim Hammer of the University of Florida Lecture Outline
Problem: Heterogeneous Information Sources “Heterogeneities are everywhere” Personal Databases World Wide Web Scientific Databases Digital Libraries • Different interfaces • Different data representations • Duplicate and inconsistent information Slide credit: J. Hammer
Problem: Data Management in Large Enterprises • Vertical fragmentation of informational systems (vertical stove pipes) • Result of application (user)-driven development of operational systems Sales Planning Suppliers Num. Control Stock Mngmt Debt Mngmt Inventory ... ... ... Sales Administration Finance Manufacturing ... Slide credit: J. Hammer
Goal: Unified Access to Data Integration System World Wide Web Personal Databases Digital Libraries Scientific Databases • Collects and combines information • Provides integrated view, uniform user interface • Supports sharing Slide credit: J. Hammer
The Traditional Research Approach • Query-driven (lazy, on-demand) Clients Metadata Integration System . . . Wrapper Wrapper Wrapper . . . Source Source Source Slide credit: J. Hammer
The Warehousing Approach Clients Data Warehouse Metadata Integration System . . . Extractor/ Monitor Extractor/ Monitor Extractor/ Monitor . . . Source Source Source • Information integrated in advance • Stored in WH for direct querying and analysis Slide credit: J. Hammer
“A Data Warehouse is a subject-oriented, integrated, time-variant, non-volatile collection of data used in support of management decision making processes.” -- Inmon & Hackathorn, 1994: viz. Hoffer, Chap 11 What is a Data Warehouse?
Need for Data Warehousing • Integrated, company-wide view of high-quality information (from disparate databases) • Separation of operational and informational systems and data (for improved performance)
Standard (Operational) DB Mostly updates Many small transactions Mb - Gb of data Current snapshot Index/hash on p.k. Raw data Thousands of users (e.g., clerical users) Warehouse (Informational) Mostly reads Queries are long and complex Gb - Tb of data History Lots of scans Summarized, reconciled data Hundreds of users (e.g., decision-makers, analysts) Warehouse is a Specialized DB Slide credit: J. Hammer
Generic two-level data warehousing architecture L One, company-wide warehouse T E Periodic extraction data is not completely current in warehouse
Independent data mart data warehousing architecture Data marts: Mini-warehouses, limited in scope L T E Data access complexity due to multiple data marts Separate ETL for each independent data mart
Dependent data mart with operational data store: a three-level architecture ODS provides option for obtaining current data L T E Simpler data access Single ETL for enterprise data warehouse (EDW) Dependent data marts loaded from EDW
Logical data mart and real time warehouse architecture ODS and data warehouse are one and the same L T E Near real-time ETL for Data Warehouse Data marts are NOT separate databases, but logical views of the data warehouse Easier to create new data marts
The ETL Process • Capture/Extract • Scrub or data cleansing • Transform • Load and Index ETL = Extract, transform, and load
Capture/Extract…obtaining a snapshot of a chosen subset of the source data for loading into the data warehouse Incremental extract = capturing changes that have occurred since the last static extract Static extract = capturing a snapshot of the source data at a point in time
Scrub/Cleanse…uses pattern recognition and AI techniques to upgrade data quality Figure 11-10: Steps in data reconciliation (cont.) Fixing errors: misspellings, erroneous dates, incorrect field usage, mismatched addresses, missing data, duplicate data, inconsistencies Also: decoding, reformatting, time stamping, conversion, key generation, merging, error detection/logging, locating missing data
Transform = convert data from format of operational system to format of data warehouse Figure 11-10: Steps in data reconciliation (cont.) Record-level: Selection–data partitioning Joining–data combining Aggregation–data summarization Field-level: single-field–from one field to one field multi-field–from many fields to one, or one field to many
Load/Index= place transformed data into the warehouse and create indexes Figure 11-10: Steps in data reconciliation (cont.) Refresh mode: bulk rewriting of target data at periodic intervals Update mode: only changes in source data are written to data warehouse
Review Data Warehouses (Based on lecture notes from Joachim Hammer, University of Florida, and Joe Hellerstein and Mike Stonebraker of UCB) Views and View Maintenance Applications for Data Warehouses Decision Support Systems (DSS) OLAP (ROLAP, MOLAP) Data Mining Thanks again to lecture notes from Joachim Hammer of the University of Florida Lecture Outline
Applications for Data Warehouses Decision Support Systems (DSS) OLAP (ROLAP, MOLAP) Data Mining Thanks again to slides and lecture notes from Joachim Hammer of the University of Florida, and also to Laura Squier of SPSS, Gregory Piatetsky-Shapiro of KDNuggets and to the CRISP web site Today Source: Gregory Piatetsky-Shapiro
Trends leading to Data Flood • More data is generated: • Bank, telecom, other business transactions ... • Scientific Data: astronomy, biology, etc • Web, text, and e-commerce • More data is captured: • Storage technology faster and cheaper • DBMS capable of handling bigger DB Source: Gregory Piatetsky-Shapiro
Examples • Europe's Very Long Baseline Interferometry (VLBI) has 16 telescopes, each of which produces 1 Gigabit/second of astronomical data over a 25-day observation session • storage and analysis a big problem • Walmart reported to have 500 Terabyte DB • AT&T handles billions of calls per day • data cannot be stored -- analysis is done on the fly Source: Gregory Piatetsky-Shapiro
Growth Trends • Moore’s law • Computer Speed doubles every 18 months • Storage law • total storage doubles every 9 months • Consequence • very little data will ever be looked at by a human • Knowledge Discovery is NEEDED to make sense and use of data. Source: Gregory Piatetsky-Shapiro
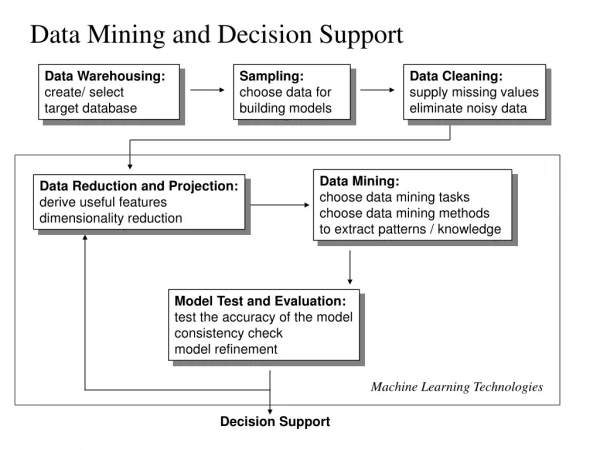
Knowledge Discovery in Data (KDD) • Knowledge Discovery in Data is the non-trivial process of identifying • valid • novel • potentially useful • and ultimately understandable patterns in data. • from Advances in Knowledge Discovery and Data Mining, Fayyad, Piatetsky-Shapiro, Smyth, and Uthurusamy, (Chapter 1), AAAI/MIT Press 1996 Source: Gregory Piatetsky-Shapiro
Related Fields Machine Learning Visualization Data Mining and Knowledge Discovery Statistics Databases Source: Gregory Piatetsky-Shapiro
__ ____ __ ____ __ ____ Patterns and Rules Knowledge Discovery Process Integration Interpretation & Evaluation Knowledge Data Mining Knowledge RawData Transformation Selection & Cleaning Understanding Transformed Data Target Data DATA Ware house Source: Gregory Piatetsky-Shapiro
What is Decision Support? • Technology that will help managers and planners make decisions regarding the organization and its operations based on data in the Data Warehouse. • What was the last two years of sales volume for each product by state and city? • What effects will a 5% price discount have on our future income for product X? • Increasing common term is KDD • Knowledge Discovery in Databases
Conventional Query Tools • Ad-hoc queries and reports using conventional database tools • E.g. Access queries. • Typical database designs include fixed sets of reports and queries to support them • The end-user is often not given the ability to do ad-hoc queries
On-Line Analytical Processing (OLAP) • The use of a set of graphical tools that provides users with multidimensional views of their data and allows them to analyze the data using simple windowing techniques • Relational OLAP (ROLAP) • Traditional relational representation • Multidimensional OLAP (MOLAP) • Cube structure • OLAP Operations • Cube slicing – come up with 2-D view of data • Drill-down – going from summary to more detailed views
Operations on Data Cubes • Slicing the cube • Extracts a 2d table from the multidimensional data cube • Example… • Drill-Down • Analyzing a given set of data at a finer level of detail
Summary report Figure 11-24 Example of drill-down Starting with summary data, users can obtain details for particular cells Drill-down with color added
OLAP • Online Line Analytical Processing • Intended to provide multidimensional views of the data • I.e., the “Data Cube” • The PivotTables in MS Excel are examples of OLAP tools
Star Schema • Typical design for the derived layer of a Data Warehouse or Mart for Decision Support • Particularly suited to ad-hoc queries • Dimensional data separate from fact or event data • Fact tables contain factual or quantitative data about the business • Dimension tables hold data about the subjects of the business • Typically there is one Fact table with multiple dimension tables
Star Schema for multidimensional data Product ProdNo ProdName Category Description … Order OrderNo OrderDate … Fact Table OrderNo Salespersonid Customerno ProdNo Datekey Cityname Quantity TotalPrice Customer CustomerName CustomerAddress City … Date DateKey Day Month Year … City CityName State Country … Salesperson SalespersonID SalespersonName City Quota
Data Mining and Visualization • Knowledge discovery using a blend of statistical, AI, and computer graphics techniques • Goals: • Explain observed events or conditions • Confirm hypotheses • Explore data for new or unexpected relationships • Techniques • Case-based reasoning • Rule discovery • Signal processing • Neural nets • Fractals • Data visualization – representing data in graphical/multimedia formats for analysis
Data Mining • Data mining is knowledge discovery rather than question answering • May have no pre-formulated questions • Derived from • Traditional Statistics • Artificial intelligence • Computer graphics (visualization) • Another term used is “Analytics” which covers much of the same topics
Goals of Data Mining • Explanatory • Explain some observed event or situation • Why have the sales of SUVs increased in California but not in Oregon? • Confirmatory • To confirm a hypothesis • Whether 2-income families are more likely to buy family medical coverage • Exploratory • To analyze data for new or unexpected relationships • What spending patterns seem to indicate credit card fraud?
Data Mining Applications • Profiling Populations • Analysis of business trends • Target marketing • Usage Analysis • Campaign effectiveness • Product affinity • Customer Retention and Churn • Profitability Analysis • Customer Value Analysis • Up-Selling
Data + Text Mining Process Source: Languistics via Google Images
How Can We Do Data Mining? • By Utilizing the CRISP-DM Methodology • a standard process • existing data • software technologies • situational expertise Source: Laura Squier
Framework for recording experience Allows projects to be replicated Aid to project planning and management “Comfort factor” for new adopters Demonstrates maturity of Data Mining Reduces dependency on “stars” Why Should There be a Standard Process? The data mining process must be reliable and repeatable by people with little data mining background. Source: Laura Squier
Process Standardization • CRISP-DM: • CRossIndustry Standard Process for Data Mining • Initiative launched Sept.1996 • SPSS/ISL, NCR, Daimler-Benz, OHRA • Funding from European commission • Over 200 members of the CRISP-DM SIG worldwide • DM Vendors - SPSS, NCR, IBM, SAS, SGI, Data Distilleries, Syllogic, Magnify, .. • System Suppliers / consultants - Cap Gemini, ICL Retail, Deloitte & Touche, … • End Users - BT, ABB, Lloyds Bank, AirTouch, Experian, ... Source: Laura Squier
CRISP-DM • Non-proprietary • Application/Industry neutral • Tool neutral • Focus on business issues • As well as technical analysis • Framework for guidance • Experience base • Templates for Analysis Source: Laura Squier
The CRISP-DM Process Model Source: Laura Squier