Effective Data Visualization & Dashboard Design Strategies
Learn how to create impactful visualizations & dashboards, avoid common mistakes, improve performance, and enhance user experience. Explore key concepts and strategies for effective communication of data.


Effective Data Visualization & Dashboard Design Strategies
E N D
Presentation Transcript
High Performance Visualizations with Silverlight Jason Beres VP, Product Management Infragistics @jasonberes jasonb@infragistics.com
About Me • Manage the product feature sets at Infragistics in the .NET, Reporting, UX, Testing, Icon products • INETA Speakers Bureau, MVP for 8 years • Founder of Florida.NET & New Jersey .NET User Groups • Author/co-Author of 8 books, latest is Silverlight 4 Professional, Wrox Press
Today’s Agenda • Introduction Data Visualization • How Data Visualization Helps Dashboards • Dashboard Design Mistakes • Improvement Recommendations • Demo – Performance • Demo – Interactive Visualization • Call To Action • Q&A
What is Data Visualization? • Wikipedia – “Data visualization is the study of the visual representation of data, defined as information which has been abstracted in some schematic form, including attributes or variables for the units of information.”
What are Dashboards? • Wikipedia - “An Executive Information System (EIS) is a type of management information system intended to facilitate and support the information and decision-making needs of senior executives by providing easy access to both internal and external information relevant to meeting the strategic goals of the organization.”
Dashboards + Data Visualization • Visual Business Intelligence • Visualizations take rich data (often KPI’s) and make it consumable • Dashboards display one or more visualizations to help users make decisions
Summary - Visualization Mistakes • Exceeding Screen • Inadequate Data Context • Excessive Detail • Deficient Measures • Inappropriate Display • Meaningless Variety • Inaccurate Encoding • Poor Data Arrangement • Ineffective Highlighting • Cluttering Display • Overuse Color • Unattractive Visual Display
Using Active Vision • Graphics are cognitive tools that extend what our brain remembers • Irrelevant information is removed from our brains and replaced with new information every second
Selective Visual Attention • Focusing the user effectively on the data you want them to see avoids competition • Use signal techniques such as color, shape, tilt, arrow, angle, fade in, blink, blur, bold, size, etc
Goal: Effective Communication w/o Info Overload • Attributes: • Visual Display • Most Important Info • Single Screen • Info Monitored at a glance • Info Understood at at a glance • Scan the Big Picture
Support Big Picture with Details • Zoom in on Specifics • Drill Down • Link to Details A Dashboard is NOT Comprehensive
Top 5 Dashboard & Visualization Success Strategies • Pick the Right Visualizations (use a UCD Process) • Create meaningful visuals with concise messaging (Tell the Truth) • Focus the user on a single set or related set of data (Show them what’s Important) • Do not create competition between visuals (Keep it Simple, think of Colors, Hues, Printing) • Maximize the data ink on a chart (Get to the Point)
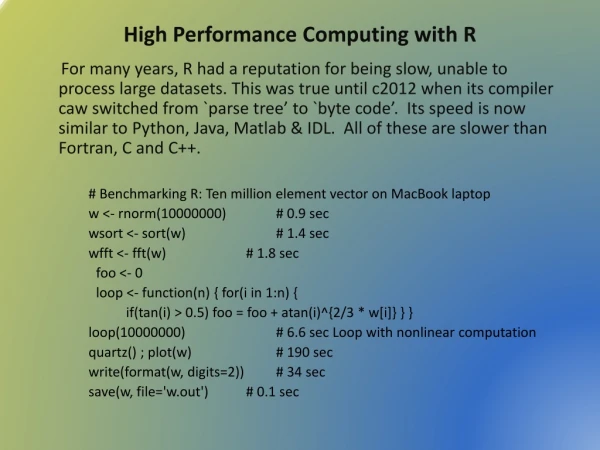
The Most Important Feature - Performance • Performance was another frequently requested improvement and was in the top 5 items that customers indicated Infragistics needed to improve on in the 2009 customer surveys. • “Performance improvement of column charts with large amounts of data” • “Performance increase with multiple series” • “Need High Performances for Live Data” • “Improve performance on real time feeds” • “Performance, performance, performance” • “We need to support large data volum[es] with good performance”
Data Performance (Rendering, Memory, Visualization) Controls for Interactive Visualizations demo
What We Learned • Careful consideration for each dashboard visualization • Use a good process to discovers what users need • Research the correct visualization type for the story you are going to tell • Charts can easily mislead • Performance is critical for exceptional UX
Resources • Quince UX Patterns Explorer • http://quince.infragistics.com • Demos – Silverlight RIA Dashboard • http://samples.infragistics.com • Web sites: • http://www.perceptualedge.com • http://www.infragistics.com/ux • http://community.infragistics.com • Books • Silverlight 4 Professional – Jason Beres, et al. • Visual Thinking for Design – Colin Ware • Information Dashboard Design – Stephen Few • Slideology – Nancy Duarte • My email - jasonb@infragistics.com • Twitter - @jasonberes
If you can’t think of any now, send me an email: jasonb@infragistics.com Questions?