Distribution of SBCMV-Response Traits in Durum Wheat under High Disease Pressure in Italy
This study examines the distribution of SBCMV-response traits in a recombinant inbred line population (Meridiano × Claudio, MxC) and a durum wheat germplasm panel, involving 181 RILs and 111 elite accessions. Conducted over four field trials in Northern Italy under high disease pressure, it analyzes symptom severity and leaf virus concentration measured using DAS-ELISA. Results highlight varying levels of susceptibility in field experiments from 2003 to 2008, providing insights into disease response for future breeding programs.

Distribution of SBCMV-Response Traits in Durum Wheat under High Disease Pressure in Italy
E N D
Presentation Transcript
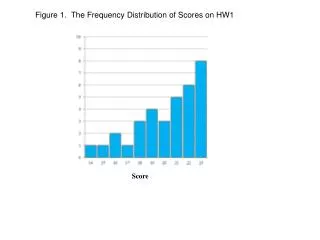
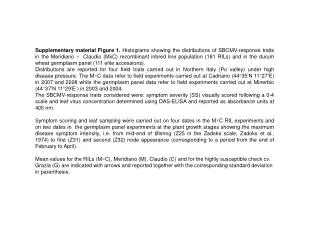
Supplementary material Figure 1. Histograms showing the distributions of SBCMV-response traits in the Meridiano × Claudio (MxC) recombinant inbred line population (181 RILs) and in the durum wheat germplasm panel (111 elite accessions). Distributions are reported for four field trials carried out in Northern Italy (Po valley) under high disease pressure. The M×C data refer to field experiments carried out at Cadriano (44°35’N 11°27’E) in 2007 and 2008 while the germplasm panel data refer to field experiments carried out at Minerbio (44°37’N 11°29’E) in 2003 and 2004. The SBCMV-response traits considered were: symptom severity (SS) visually scored following a 0-4 scale and leaf virus concentration determined using DAS-ELISA and reported as absorbance units at 405 nm. Symptom scoring and leaf sampling were carried out on four dates in the M×C RIL experiments and on two dates in the germplasm panel experiments at the plant growth stages showing the maximum disease symptom intensity, i.e. from mid-end of tillering (Z25 in the Zadoks scale, Zadoks et al., 1974) to first (Z31) and second (Z32) node appearance (corresponding to a period from the end of February to April). Mean values for the RILs (M×C), Meridiano (M), Claudio (C) and for the highly susceptible check cv. Grazia (G) are indicated with arrows and reported together with the corresponding standard deviation in parenthesis.
100 100 90 90 MxC RIL SS1-07 MxC RIL SS3-07 80 80 70 70 70 RIL number 60 60 C (1.9 ± 0.7) M (0.1 ± 0.1) G (3.2 ± 0.3) M (0.1 ± 0.1) C (2.5 ± 0.3) G (3.1 ± 0.2) RIL number RIL (1.3) RIL (1.2) 50 50 40 40 30 30 20 20 10 10 1 0 3 4 2 0 1 3 4 2 Symptom score unit Symptom score unit 100 100 MxC RIL SS2-07 90 90 MxC RIL SS4-07 80 80 70 70 RIL number M (0.3 ± 0.3) C (2.1 ± 0.5) G (3.1 ± 0.2) 60 C (2.7 ± 0.3) M (0.1 ± 0.1) 60 G (3.8 ± 0.3) RIL number RIL (1.6) RIL (1.4) 50 50 40 40 30 30 20 20 10 10 0 3 4 0 1 3 4 2 1 2 Symptom score unit Symptom score unit
MxC RIL ELISA2-07 MxC RIL ELISA4-07 60 60 C (1.4 ± 0.3) G (1.5 ± 0.3) C (1.8 ± 0.2) G (1.9 ± 0.2) M (0.8 ± 0.5) 50 M (1.2 ± 0.6) 50 RIL (1.2) RIL (1.4) 40 40 RIL number RIL number 30 30 20 20 10 10 1 2 0 0.5 1.5 1 2 0 0.5 1.5 Absorbance units (A 405 nm) Absorbance units (A 405 nm)
100 MxC RIL SS1-08 MxC RIL SS3-08 100 90 90 80 80 70 70 M (0.0 ± 0.0) M (0.0 ± 0.0) C (0.4 ± 0.4) G (2.0 ± 0.9) C (1.8 ± 0.7) G (3.6 ± 0.3) RIL (1.3) RIL (0.6) RIL number RIL number 60 60 50 50 40 40 30 30 20 20 10 10 1 2 0 0 3 4 3 4 1 2 Symptom score unit Symptom score unit 100 100 MxC RIL SS4-08 MxC RIL SS2-08 90 90 80 80 70 70 RIL number M (0.2 ± 0.0) M (0.3 ± 0.4) C (2.3 ± 0.5) G (3.5 ± 0.3) C (2.2 ± 0.5) G (3.5 ± 0.3) RIL (1.5) RIL (1.7) RIL number 60 60 50 50 40 40 30 30 20 20 10 10 0 0 3 4 3 4 1 1 2 2 Symptom score unit Symptom score unit
MxC RIL ELISA2-08 MxC RIL ELISA4-08 60 60 50 50 M (0.4 ± 0.7) M (0.3 ± 0.4) C (1.9 ± 0.2) G (2.0 ± 0.0) G (2.0 ± 0.0) C (1.6 ± 0.6) RIL (1.1) RIL (1.2) 40 40 RIL number RIL number 30 30 20 20 10 10 1 2 0 0.5 1.5 1 2 0 0.5 1.5 Absorbance units (A 405 nm) Absorbance units (A 405 nm)
50 50 Durum Panel SS1-04 Durum Panel SS1-03 40 40 G (2.7 ± 0.2) G (2.8 ± 0.2) Accession number Accession number 30 30 20 20 10 10 0 0 3 4 3 4 1 1 2 2 Symptom score unit Symptom score unit 50 50 Durum Panel SS2-04 Durum Panel SS2-03 40 40 G (3.3 ± 0.3) G (2.7 ± 0.0) Accession number Accession number 30 30 20 20 10 10 0 0 3 4 3 4 1 1 2 2 Symptom score unit Symptom score unit
Durum Panel ELISA1-03 Durum Panel ELISA1-04 60 60 50 50 G (1.4 ± 0.2) G (1.7 ± 0.0) 40 40 30 30 Accession number 20 20 10 10 1 1 2 0 0.5 1.5 2 0 0.5 1.5 Absorbance units (A 405 nm) Absorbance units (A 405 nm) 60 60 Durum Panel ELISA2-03 Durum Panel ELISA2-04 50 50 G (1.4 ± 0.1) G (1.8 ± 0.0) 40 40 30 30 Accession number 20 20 10 10 1 0 0.5 1.5 2 1 2 0 0.5 1.5 Absorbance units (A 405 nm) Absorbance units (A 405 nm)