Download
1 / 14
150 likes | 359 Vues
Examine Quantity Theory of Money. Structural Change by 1973 Oil Crisis. Part A Examining the Quantity Theory of Money Part B Test Whether 1973 Oil Crisis cause a structural change. About Quantity Theory of Money.

E N D
Examine Quantity Theory of Money Structural Change by 1973 Oil Crisis
Part A • Examining the Quantity Theory of Money Part B • Test Whether 1973 Oil Crisis cause a structural change
About Quantity Theory of Money • The Quantity Theory was first developed by Irving Fisher in the inter-war years as is a basic theoretical explanation for the link between money and the general price level. • Roughly speaking, the Quantity Theory try to explain the cause of inflation. • The Theory is argue that the inflation is caused by the growth of Money Supply
Cause of inflation • The Quantity Theory • Neo-Keynesian • Cost push inflation • Demand pull inflation • Built-in inflation
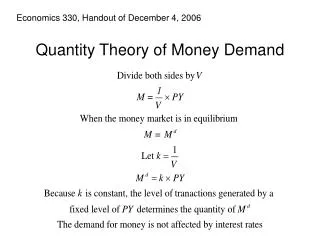
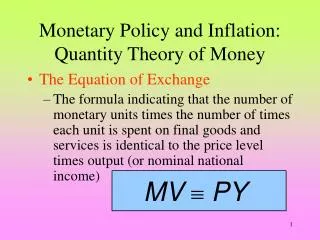
Methodology • Fisher identity or equation of exchange MV = PY • M is the money supply • V is the velocity of circulation of money • P is the general price level • Y is the real value of national output (i.e. real GDP)
Fisher identity or equation of exchange MV = PY lnM + lnV = lnP + lnY • To test the cause of growth of price level (inflation), we yield lnP = lnM + lnV - lnY
To simplify our examining, we hold the growth rate of the velocity of circulation of money (V) being constant (β0 ). • Thus, we yield the regression like this: lnP = β0 + β1lnM + β2 lnY
Sample • Country: United States • Period: 1959Q1 to 2010Q3 • Data: • M is M2 • P is the GDP Deflator • Y is the real GDP
Result • We run a OLS estimation on the regression: lnP = β0 + β1lnM + β2 lnY The result is: lnP = 2.918171+ 0.893281lnM - 0.650627 lnY R-squared = 0.992265 RSS = 0.603807 • We can conclude that the Quantity Theory of Money significantly explain the cause of inflation (0.33306) (0.028347) (0.061715)
Test Whether 1973 Oil Crisis cause a structural change • 1973 Oil Crisis lead the GDP growth of US decreased by 4.7% • It shows that 1973 Oil Crisis is a serious economic shock for US • It is worth to test that whether 1973 Oil Crisis bring a structural change (in term of the effect of the growth of money supply and output to the inflation.)
H0:No structural change, Var(1)=Var(2) =σ2 H1 : Yes, there is a structural change, Var(1)≠Var(2)≠σ2 Methodology • The Chow test is used to do the test. • Separate the whole period to two sub-periods: • 1959Q1 to 1973Q3 • 1973Q4 to 2010Q3 • Establish the Hypothesis:
Run OLS on two sub-sample groups separately and obtain the RSS1, and RSS2, (RSS1+RSS2=RSSUR) • Run OLS on the whole sample (N) and obtain the • restricted RSSR • Compute: • F* = • If F* > Fc , k+1, N-2k-2 ==> reject H0 [(RSSR - RSS1RSS2)/k+1]/ (RSS1 +RSS2)/N-2k-2
RSSR (Whole Period)=0.603807 • RSS1 (1959Q1 to 1973Q3) = 0.029737 • RSS2 (1973Q4 to 2010Q3)= 0.445407 • By computation: • F*= 18.14275, where Fc =3.9491 • Where α=0.01
Since F*= 18.14275, Fc =3.9491 • F* > Fc , k+1, N-2k-2 ==> reject H0 • There is a structural change, Var(1)≠Var(2)≠σ2 • We can conclude that the effects of the growth of money supply and output to the inflation have had a structural change after 1973 oil crisis!