Results Section
Results Section. Shainn-Wei Wang, Ph.D. NCKU, College of Medicine Institute of Molecular Medicine. “What did you find” is in Results. Dogma. Why a scientific format?. Logic: U niform manner for efficient communication of scientific findings Simplicity:


Results Section
E N D
Presentation Transcript
Results Section Shainn-Wei Wang, Ph.D. NCKU, College of Medicine Institute of Molecular Medicine
“What did you find” is in Results
Why a scientific format? • Logic: Uniform manner for efficient communication of scientific findings • Simplicity: allows the paper to be read at several different levels
Some exceptions • Occasionally, certain scientific papers require organization modifications • incorporate the Materials and Methods and Results into an "Experimental" section • immediate discussion of result observations requiring a combined Results and Discussion section • a wide variety of variations of the standard format in descriptive areas of science • the Instructions to Authors of the target journal explain the options available to prospective authors
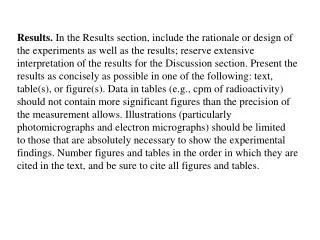
What are the "results"? • Accumulate observations and analysis about your samples or experimental phenomena • Accumulate experimental observations and analysis for your testable hypothesis • In general, the conclusion of your observation is the " key result". • Describe the “key result” with the supporting evidence from “your data”
Results-the core of the paper • Should be presented according to the experimentation design that yielded them • The logic decision of data selection • which data are representative and should be included • which data are repetitive and have no value • The compulsion to include everything, leaving nothing out, does not prove that one has unlimited information; it proves that one lacks discrimination • Results should be short and sweet with crystal clarity • The entire success of the paper is dependent upon the results • Graphic techniques should be used with great advantage to illustrate trends and data relationships • It is not the readers responsibility to analyze data • it is the authors job to identify and direct the authors attention to major features or trends of the data • great care should be taken in graphics construction since they must be in the printing process. • Do not abuse data graphics by referring to them as; "It is clearly seen in Table 1 that…".
The major difference between Results & discussions…What are the “Discussions”? • The function of the Discussion • to interpret your results in light of what was already knownabout the subject of the investigation • to explain new understandingof the problem after taking your results into consideration
Discussion-the antenna for communications • Connect and communicate with the Introduction • Communicate with the literatures (the fundamental questions to answer)
Connect and communicate with the Introduction • it tells how your study has moved us forward from the place you left us at the end of the Introduction • by way of the question(s) or hypotheses you posed and the literature you cited, but it does not simply repeat or rearrange the Introduction • Introduction“ and the „Discussion“ should be closely related to the results of your study (although after a literature search it is tempting at times to feature the whole field in a „review-like“ presentation).
Communicate with the literatures • Do your results provide answers to your testable hypotheses? If so, how do you interpret your findings? • Do your findings agree with what others have shown? If not, do they suggest an alternative explanation or perhaps a unforeseen design flaw in your experiment (or theirs?) • Given your conclusions, what is our new understanding of the problem you investigated and outlined in the Introduction • If warranted, what would be the next step in your study, e.g., what experiments would you do next?
Writing the Results Section- the logic sequence 1. Analyze and interpret the results once the data are collected 2. Write the Table and Figure legends 3. Write the Results Section
1. Analyze and interpret the results • Analysis will include • data summaries (mathematic calculation / quantitation / judgment based on: Pos/Neg controls, means, variances, and etc.) • mathematic evaluations or statistical tests to verify conclusions • About the use of the word significant(ly): • this word implies that a statistical test was employed to make a decision about the data • Interpetation • Data analysis + Central idea + Logic evaluation • Most scientists lay out their Tables and Figuresupon completion of the data analysis before writing the Results section
2. Write the Table and Figure legends • Write one or two key resultsthat each Table or Figure conveys and use this information as a basis for writing the outline of the Results section. • Sequence and number the Tables and Figures in the order which best enables the reader to reach your conclusions.
Example-the outlines • Virus particle production by NC mutants. (major title A, • “platitudinous” outline is acceptible when you have inconsistent or many different observations to talk about. In this case, I would expect that subtitle/suboutline to be more specific) subtitle 1… (a hidden title…should be a topic sentence that allows you to describe your observations or analysis) subtitle 2…. • Stability and recovery of NC mutant viral particles. (major title B) • RNA incorporation in NC mutants.(major title C) • Role of RNA in PRparticle stability.(major title D)
Example-the outlines • Outline (major title) A: Particle production of M1-2/BR, a mutant virus thatshows reduced RNA incorporation. (showing a major conclusion/key result/take home message) subtitle 1: you are going to talk about the yields of mutant and wt particles (this may include a suggestion of meaning) subtitle 2: you are going to talk about the amounts of RNA inside the mutant and wt particles (this may include a suggestion of meaning) subtitle 3: you are going to give a major conclusion (key result) or suggestions for your observations, if you think the data are very complicated and require another paragraph to get across the idea of your observations
3.Write the Results Section • Including text and illustrative materials (Tables and Figures) • Use the text component to guide the reader through your key results • Outline and connectyour key results • Each Table and Figure must be referenced. you must tell the reader what the key result(s) is that each Table or Figure conveys.
4 major brewing processes • Knowing what information to include or exclude • How to logically state the results of your study • How to efficiently refer the reader to a table or figure • How to give the data the “Suggestion of meaning” based on the presented data
Knowing what information to include or exclude • Gathering the supporting evidence • do not deviate from the central idea • select the one that best describe the phenomenon but not your own expectation • The fool collects facts; the wise person selects them • Each figure or table should have a central idea • Be honest with your data • Conflicting data • requires an explanation (details in discussion) • more experiments to confirm this
Suggestion of meaning • Suggestion should be logic and close related to your data • Virions with aberrant morphology could be observed in both pM1-2/BR/PR (Fig. 2a) and pHXB2/PR (Fig. 2b), suggesting that the aberrant morphology is more likely the result of the mutation in PR than in NC. (suggestions should be closely related to your data)
Report negative results - they are important! • If you did not get the anticipated results: • it may mean your hypothesis was incorrect and needs to be reformulated • or perhaps you have stumbled onto something unexpected that warrants further study • In either case, your results may be of importance to others even though they did not support your hypothesis. • Do not fall into the trap of thinking that results contrary to what you expected are "bad data" • If you carried out the work well, they are simply your results and need interpretation. • Many important discoveries can be traced to "bad data".
Summary • Outline the key results of your data • Data are best illustrated by figures and tables • Figures and tables should be made to stand alone • Logic description and guiding based on the data • An ideal paper usually has 7 figures and 3 tables
Table 1. Title 2. Table body 3. Descriptions
Figure 1. Figure body 2. descriptions: better to have a short title
The format of tables and figures • has several lines of text in the legend - explain the information that is being presented - made to stand alone • A table's legend appears above it, while the legend for a figure appears below the figure
The Statistics • If your table includes the results of a statistical analysis, be sure to provide the information necessary for the reader to properly evaluate the analysis (probability levels, degrees of freedom, sample size, etc.).
Tips-1 • Do not include in the text the same data in both a table and a figure • Best to present the numeral data in a table unless there is visual information that can be gained by using a figure
Examples • SIVspecific IgG responses were weak, ranging from 1:100 to 1:2,560 on the day of challenge (Table 4)
Importance of writing the title (or outlines of your “Results) • This links to the structure of your manuscripts • Try this: Begin at the end! • Write down conclusions (key results) as clearly/precisely as possible • Then try to design a tentative yet meaningful title (outlines). • Try to incorporate into your title a result, a conclusion, some kind of “take-home message“, something you want the reader to remember. • Try to avoid platitudinous titles (or outlines) like „Analysis of 47 tumors for“, or „Investigation of the level of.....“. To the critical reader/reviewer this indicates that your study has not produced a meaningful result • This tip also apply to the “Introduction“ and the “Discussion“ : initially choose a number of headlines, under which you present your thoughts. Eventually remove the headlines and combine each section or chapter. • As the next step you should write a tentative abstract, as short version of what you want to say. • This will guide you in deciding of what you want to write/focus in the main body of the manuscript
Some general suggestions 1. Save words • Be simple and brief: • should not be confused with deleting information • …the most frequent among its localizations is the nuclear one.“ …it is most frequently localized in the nucleus • Aim at a balance between “as much as necessary“ and “not more than neccessary“. • Avoid phrases like: • the next highly interesting result was obtained... • As shown in Fig. 3, the sky was blue. The sky was blue (Fig. 3) • The data of the analysis on cell cycle parameters are shown in Fig. 1. They have revealed that the cell cycle is advanced by factor X... Factor X advances the cell cycle (Fig. 1), indicating that ...
2. Consistency • Be consistent in definitions. Always use the very same term for the same procedure, the same context to identify a clone, a cell line etc. 3. Structure • Write a step by step procedure in a logical order. • adding the phages after three washes... after three washes the phages were added... • Describe things always in the same order you have started with. • If you have started A, B and C it is only confusing if you use in the next chapter a B, A, C order.
4. Avoid Redundancy • Do not repeat the same opinion, argument, fact in successive sentences to try making something more clear to the reader, instead use the most precise phrase, and only once. • sometimes you detect something in the literature that is new to you. BE AWARE: This might not be new to the reader of your paper. So don’t go into any more detail on this than if it would be known to you well. 5. Avoid Emotions • No emotions/ personal feelings • avoid words like: surprising, interesting, astonishing,....
6. Avoid Uncertainty • Use only one degree of uncertainty per sentence • This appears to indicate that factor A possiblymayhave a tendency to interact with factor This indicates (suggests) that factor A interacts with factor B 7. Avoid Ambiguous terms • be precise! • No: quite, as described above, aforementioned, very, rather, fairly, relatively, comparatively, several, much, a lot, a couple, further down 8. Spellings • Try to use a good dictionary (i.e. Webster’s) to check spellings. • Be careful to use the right spelling from the first draft.
9. Comma • some basic rules for using a comma: • a. A comma is used when the subject changes. ...the slides were washed, and the phages were dropped.... • b. Try to understand the difference: • Those bacteria that were purified were all resistant.... (no comma) • The neomycin resistant bacteria,which can be selected by growing them on agar plates containing antibiotic, all should contain the neoR-plasmid (the “which“ following the comma is an explanation). • c. “ ,respectively, “ ; but be careful to use this word in a way that is correct • d. Also, early at the beginning of sentences, like: „Next, we analyzed............“ „There, the difference........“
10. Paragraphs • Order one coherent thought into one paragraph. Use a logical order of thoughts. Avoid repetitions. • And remember: one sentence does not make a paragraph!
11. Style • There is only one style in scientific writing • It is dictated by precision in expressing what you want to say. • This requires discipline and concentration. Because this is hard work, the fewer words you use the better it is for you. • Precipitation of DNA was achieved by the addition of alcohol DNA was precipitated with alcohol • Follow four rules: - be simple and concise - make sure of the meaning of every word • use verbs instead of nouns e.g. • Check each sentence:does it provide the information in a way that it is not misunderstood?
12. Possessiveness • Do not use possessive pronouns! Avoid we, we, we, we, we, I, I, I, I, I, I, our, us, .... • Just present the facts!...previous studies have shown (Ref.)... • this gene localizes in our contig .... ...localizes to the contig previously published (Ref.)... 13. Importance (Avoid self-adulation!!!) • Some authors have a tendency to point out that their work is extremely important. Some readers (including reviewers!) are annoyed by this habit. • It is actually better to avoid phrases like -...we have found for the first time.. ... this study presents additional (or similar) information.... -... we were the first to report.... -... we have for a long time predicted and now we have shown... ... this study confirms our previously published ideas ...
14. Emphasis • Be restrictive in using: • Very • Extremely 15. Avoid alluding to other sections in the manuscript • “...as described above/before...“ • “...as will be described later...“
16. Avoid the ”Materials and Methods” in the Results • The main sentence should not address what you are doing, it is reserved for the result (observations & findings) • The „doing“ should be dealt with under „materials and methods“. • May briefly describe experimental approaches in a way necessary to understand the experiment 17. Avoid extensive interpretations in the Results • these are reserved for the „Discussion“.. • “The resulting phages were analysed. They showed ...“ ”Analysis of the resulting phages showed ....!
18. Prepare brilliant illustrations • Before preparing illustrations, please look at some reputated journals and try to find an illustration that is similar to the style of the one you want to prepare. • Sending small, stamp-like figures to an Editor is a waste of time, the manuscript most likely will be returned. • Please understand that reviewers ,when they have difficulties to decipher the meaning of illustrations, tend to reject the manuscript. 19.Use a good letter size, avoid wasting space. • Putting a tiny picture on a large piece of paper is a wast of space! • Use electronic files for arranging groups of pictures. Particular attention should be given to colour illustrations that are grouped together on a page. Again, inspect a number of manuscripts in reputable journals
20. When results were discussed in the “Discussions” • Do not refer to original data or illustrations. (fig. 3) • Do not repeat data in the Discussion. • Our analysis had revealed that 20% of the chromosomes were broken. Additionally, in 10% of the broken chromosomes the gene X was mutated. This shows that there is a preferential ... “The incidence of 20% broken chromosomes of which 10% had gene X mutations shows a preferential...” • No data in the main sentence
21. Nomenclature • General:species and all Latin derivates are in italics (in vivo, post mortem, etc.) • Human genes:all caps and italics (MYCN) • Mouse genes: first letter cap, rest lower case, italics (Brca 2) • Proteins: first letter cap, rest lower case, no italics (Brca 2) • Restriction enzymes: check supplier, but usually it is a combination of italics and non-italics (e.g. BamH )
22. Miscellaneous • ...a number of genes have been ...(often used, but incorrect, subject is singular) ...many genes have been.... • A majority of aberrations were concordant... Most aberrations were concordant........... • There are a variety of data that suggests......... Or: ........this data was ascertained... Several data suggest that.......... these data were ascertained..... - ...single clones were obtained and cell lysates prepared ... (don’t omit the verb) ...single clones were obtained, and cell lysates were prepared
Discussion Section Shainn-Wei Wang, Ph.D. NCKU, College of Medicine Institute of Molecular Medicine
What do these findings mean? Your answer is the Discussions
Something about the “Discussions” • More difficult to define than the other sections • Rejection & inadequate discussion preparation • Where you will analyze and interpret the results of your experiment. • Most discussions tend to be too long for their intended purpose or for the available results • The "squid" technique prevails and the author, not knowing what to say about the results, hides behind a protective cloud of ink • You should state your conclusions in this section. Do not use the word prove in your conclusions. • Your results will support, verify,orconfirm your hypothesis, • or they will negate, refute, or contradict your hypothesis; • the word prove is not appropriate in scientific writing.
The discussion should attempt to: • Present the principles, relationships and generalizations shown by the results. It should discuss, not reformulate the results. (PP) • Summarize the evidence of the study for each conclusion. (SE) • Point out any exceptions or lack of correlation and define any unsettled points. (PC) • Show how your results and interpretations agree or disagree with previously published works. (SAD) • Discuss any theoretical implications or practical applications of the results. (DIA) • Reaffirm the major conclusions or findings as clearly as possible. (RC)
Before writing the Discussions 1. Complete your Introduction and Results sections before you begin writing the discussion. • As you study the information in the Introduction section and your data in the Results section, write down relationships and integrate these relationships into a rough draft of your discussion. 2. The figures and tables in the Results section will be particularly important as you begin to think about your discussion. • The tables allow you to present your results clearly to the reader • graphs allow you to visualize the effects that the independent variable has had on the dependent variables in your experiment. • Studying these data will be one of the first steps in interpreting your results.