Educational Accountability Ratings and Analysis
Detailed overview of State and Federal accountability ratings for academic indicators, completion rate, dropout rate, and campus performances. Includes statistics and subgroup breakdowns for diverse categories.

Educational Accountability Ratings and Analysis
E N D
Presentation Transcript
Accountability 2008 - 2009 State and Federal Ratings August 11, 2009 Board Presentation
State Accountability • 35 Indicators • 25 are Academic • (Combined grades 3-11) • 5 are completion rate • High Schools only (Grades 9-12) • 5 are dropout rate • Junior Highs (Grades 7-8) • Elementary accountable only for academic indicators
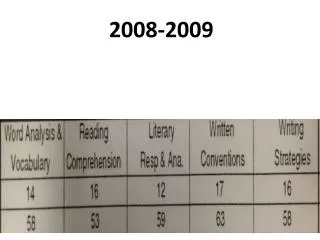
State Accountability 25 Academic Indicators • Standards for Accountability ratings
Social Studies: Grades 8,10,11 + TAKS-AccomState Accountability
Science: Grades 5,8,10,11 + TAKS-Acc + SpanishState Accountability
State Accountability • District Rating • Academically Unacceptable • Cohort group entering 9th grade in 2004 • Graduating Class of 2008 • Standard = 75% • Economically Disadvantaged Subpop • 103 Students of 344 = 67.7% (-1.4%)
State Accountability • Good News for Completion Rate (9-12) • All other subpops increased • All students by 3% (82% to 85%) • African American -- 6.7% • Hispanic -- 4.8% • White – 2.9%
State Accountability • Good News for Dropout Rate (Gr. 7-8) • All subpops improved: • All Students -- .7% to .1% • African American -- .9% to 0% • Hispanic -- .6% to .2% • White -- .8% to .1% • EcoDis -- .8% to .1%
Campus State Accountability • Lee HS & Midland HS • Unacceptable due to Completion Rate • Economically Disadvantaged Subgroup • Standard = 75% • LHS = 74.5% MHS = 73.5% • Lamar Elementary • Unacceptable in math in one subgroup • Travis Elementary • Unacceptable in science performance across campus
Federal Accountability • 26 Indicators(remember State has 35) • 24 are Academic • (Combined grades 3-10 & 11) • 1 is completion rate • High Schools only(Grades 9-12) • 1 is dropout rate • Junior Highs (Grades 7-8) All TAKS Tests included in calculations: (TAKS, TAKS-Accom, TAKS-M, TAKS-Alt, LAT)
Federal Accountability • District – Meets Standard Campuses: • MHS – Does not meet standard • Participation in ELA TAKS 92% (95% st.) • Travis Elementary – Does not meet standard • Math scores in 3 subpops • Milam Elementary – Does not meet standard • Math scores in one subpop
District Academic Focus for 2009-2010 • Limited English Proficient Students • Bilingual (K-5); ESL (6-12) and Parent Denials (K-12) • African American Students • Special Education Students • Economically Disadvantaged Students • Specifically grades 9-12 ALL Students!