Minimum Energy Sub-Threshold CMOS Operation Given Yield Constraints
120 likes | 262 Vues
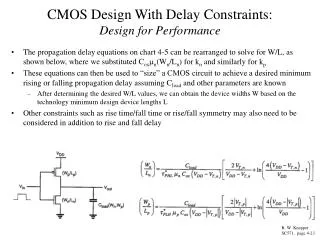
Minimum Energy Sub-Threshold CMOS Operation Given Yield Constraints. Max Dreo Vincent Luu Julian Warchall. Problem Frame. - Subthreshold Operation - Power over performance - Threshold Voltage Variation! - Dependent on transistor size - Subthreshold Current:. Problem Frame (cont.).

Minimum Energy Sub-Threshold CMOS Operation Given Yield Constraints
E N D
Presentation Transcript
Minimum Energy Sub-Threshold CMOS Operation Given Yield Constraints Max Dreo Vincent Luu Julian Warchall
Problem Frame - Subthreshold Operation - Power over performance - Threshold Voltage Variation! - Dependent on transistor size - Subthreshold Current:
Problem Frame (cont.) - Variation-Induced Errors - Timing - Functionality
Problem - To meet a given yield requirement should you (a) increase the voltage of your subthreshold circuit's power supply, (b) increase the size of its transistors, or (c) use a combination of both?
Ring Oscillator -odd number of cascaded inverters using feedback -able to determine failure automatically and apply results for a generalizable conclusion
Monte Carlo Analysis -Vary threshold voltage statistically and measure average current and frequency -Edited transistor model files to force first-order Vth dependence on area -Able to determine failure when frequency is not measurable
Assumptions -As size or Vth increase, failure rates decrease exponentially:
Approach -generate failure rate graphs with simulations -pick n and failure constraints and solve for optimal Vdd and size to minimize energy
Simulations and Issues -Technology: 90nm -Voltage: 260-300 mV -Size: 90-190nm -Edited model files to include process and mismatch variations with a standard deviation of 25%. -Inverter Chain of 101 -Only had 100 MonteCarlo sims per measurement point -Why 101 inverters? Why 100 trials? Why 25%? -lack of resources, had to observe enough failures in order to collect data.
Conclusions and Future Work -In the process of analyzing data. -Want to graph voltage, size, and energy per operation based on a specific failure rate. -Constraints caused issues in our data gathering stage. -Redo the same simulations but with additional trials to get better data.