Download
1 / 17
170 likes | 252 Vues
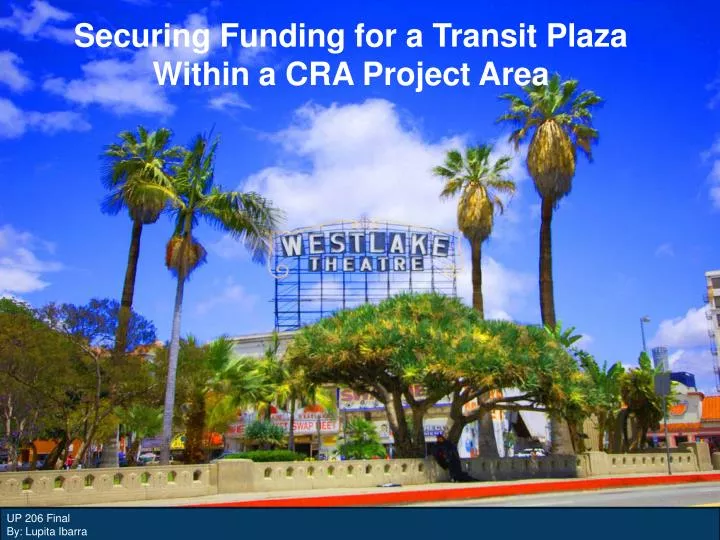
Securing Funding for a Transit Plaza Within a CRA Project Area. UP 206 Final By: Lupita Ibarra. Policy Question. Which project area within the Community Redevelopment Agency for the City of Los Angeles is best suited for a transit plaza ? Where should it be located within the selected area?.

E N D
Securing Funding for a Transit Plaza Within a CRA Project Area UP 206 FinalBy: Lupita Ibarra
Policy Question Which project area within the Community Redevelopment Agency for the City of Los Angeles is best suited for a transit plaza? Where should it be located within the selected area?
Why a Transit Plaza? What is a Transit Plaza? Transit Plazas are quasi-transit villages. They work with existing infrastructure to create linkages between different modes of transportation while diversifying land use and improving the socio-economic conditions of the area. Why? The Los Angeles Neighborhood Initiative (LANI) intends to apply for the Caltrans Community Based Planning Grant and it needs a transit angle. Work with CRA/LA to secure additional funding for completing projects Establish aid in areas with large transit dependent populations within the City of Los Angeles
Percent of Population Below Poverty Percent of Transit Dependent Percent of Renters CRA/LA Project Area Demographics
East Valley Project Region Identified Vacant Parcels by CRA/LA Project Region City of Los Angeles Hollywood & Central Project Region West Valley Project Region
Eastside Project Region Identified Vacant Parcels by CRA/LA Project Region (continued) Downtown Project Region City of Los Angeles LA Harbor Project Area South Los Angeles Project Region
Priority Index Priority Index by Region Priority Index by Area
Pedestrian & Bicycle Collisions Pedestrian and Bicycle accidents are not equally distributed throughout Westlake, but rather they are concentrated around areas with higher population densities.
Transit Dependency Around Qualified Vacant Parcels Maps illustrate connectivity around qualified vacant parcels. A 0.5 mile buffer is drawn around the parcel with the greatest amount of connectivity points.
Crime, Infrastructure and Median Income • - Priority Intersections were identified based on the following: • lack of sidewalk width and infrastructure and • perceived danger/conflicts between pedestrians, bicyclists and vehicles. • - The purpose of identifying crime areas is to prioritize regions where existing infrastructure can be improved to reduce crime. Theft is reported by the amount of incidents per 1,000 people of pedestrian traffic flow.
Hotspot Analysis • Transit Plaza Need Index: • Based on the Median Income, Transit dependency, Population Density, Number of Vehicular Collisions, Number of Reported Crimes, and Areas Identified by the CCNP for Improvement
Transit Plaza Area Selected The vacant parcel on 8th St. and Alvarado is best suited for a transit plaza.
Skills Utilized Layout with seven layers- slide 10 Modeling- slide 13 Metadata- slide 17 Measurement ORIGINAL DATA/GEOCODING I geocoded crime rates for a 1 year span, then I drew redevelopment boundaries and created a new shapefile Intersecting information- Parcel, Census tract, and Land Use Charts and Images Hotspot Analysis- slides Inset Map Graduated Symbols Creating an Index Distance Buffering
Raster Model Slides: 10, 11, 12, and 13