Download
1 / 40
400 likes | 565 Vues
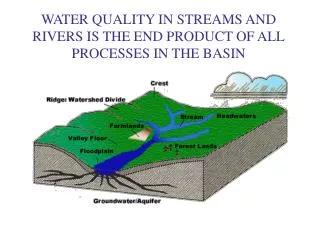
Improving Water Quality: The Ultimate Outcome of Stormwater Programs. Craig Hesterlee, EPA R4 Watershed Management Office South Carolina Watershed Coordinator USC Stormwater Forum 5/08/2007 Columbia, SC. http://www.epa.gov/athens/research/impervious/shapes.html.

E N D
Improving Water Quality: The Ultimate Outcome ofStormwater Programs Craig Hesterlee, EPA R4 Watershed Management Office South Carolina Watershed Coordinator USC Stormwater Forum 5/08/2007 Columbia, SC
Regional Analysis Of Relationship Between Imperviousness and Impairment • 42.2% of subwatersheds with impairment can be found in HUCs with >=5 percent total impervious area (TIA), even though those account for only 13.4% of the Region's subwatersheds • TIA >= 5% are about 2X as likely to have a Pathogens- or Habitat Alteration-impaired waterbody, and with TIA >=10% are about 2X as likely to have a Sediment-impaired waterbody • TIA >= 5% contain 49% of the Pathogens impairments, 38% of the Habitat Alteration impairments, and 32% of the Sediment impairments • SC Imperviousness future projections suggest continued and more prevalent rate of degradation • Population expected to increase by 1 million (2000 to 2025) • 866 additional miles of stream projected to be “threatened” by development in 2025 Source: EPA/600/R-05/061 May2005
South Carolina Impervious Cover Projected to 2025 Source: EPA/600/R-05/061 May2005
Urban Stormwater Management Strategy: MS4 Outreach • Major restoration implementation mechanisms • Helping MS4s set measurable goals with water quality outcomes • Water quality outcomes increase local funding potential • Need low-cost technical and regulatory assistance! Results Solution Phase “Data Collection” How are these measured?
Goals for MS4 Reporting Less Information Program Outcomes TARGET! More Information
Implementing TMDLs Through SWMPs • TMDLs are “living plans” that require measurable pollutant load reductions to be implemented • TMDLs must be maintained after the restoration goal is achieved • TMDLs should be periodically updated to reflect changing water quality conditions or growth scenarios • TMDL implementation requires MS4s to choose “rational” BMPs that will ultimately mitigate the impact of the MS4 load on ambient water quality
Implementing TMDLs Through SWMPs • MS4s are most likely measuring the implementation of program elements (outputs) rather than impacts (outcomes) “result” • Specific Guidance needed for measuring pollutant load reductions • Regulators should emphasize program outcomes, not outputs • MS4 communities vulnerable to citizen lawsuits over TMDL implementation
Evaluating Effectiveness of SWMP’s • Current EPA OWM Guidance • OWM provided an extensive list of potential reportable MS4 activities (outputs) that imply implementation of minimum control measures • OWM did not define Maximum Extent Practicable or indicate appropriate minimum levels of effort • SWMP’s are currently graded using best professional judgment (BPJ), in lieu of specific guidance
Evaluating Effectiveness of SWMP’s Example EPA-OWM Guidance • Post Construction Storm Water Runoff Control in New Development/Redevelopment • ALTERNATIVE TURNAROUNDS• The reduction in impervious cover. • The number of turnarounds modified. • Whether or not development codes were changed to allow alternative turnarounds. • The reduction in runoff quantity. • Changes in the physical characteristics of streams downstream from modified areas. • ALTERNATIVE PAVERS• Whether or not development codes were changed to allow for alternative pavers. • The amount of new alternative paver installations added or replaced. • The number of new development sites that use alternative pavers. • The reduction in runoff quantity. • Changes in the physical characteristics of streams downstream from areas with alternative paver installations. • ALUM INJECTION• Whether or not an inventory of sites where alum injection was used was completed. • Changes in water quality. • Changes in biological populations. • BIORETENTION• The reduction in impervious cover. • The reduction in runoff quantity. • Changes in runoff water quality (nutrients, sediments, metals, organics, etc.). • The number of new bioretention cells installed (both commercial and residential). • The number of acres that are drained by bioretention cells. • BMP INSPECTION AND MAINTENANCE• The frequency of inspection and maintenance activities. • The number of problems that were identified and remedied. • The change in the proportion of BMPs that are well-maintained as a result of inspection and maintenance. • Whether or not an inventory of BMPs requiring maintenance was completed and is regularly updated. • Changes in water quality of effluent from BMPs. • BUFFER ZONES• Whether or not development codes were changed to require buffer zones. • The acreage of land conserved as buffers. • The acreage of land converted to buffers. • Changes in water quality of runoff leaving buffer areas. • Changes in the physical characteristics of streams downstream from areas with buffer zones. • The frequency of inspections and maintenance activities in buffer zones. • The acreage that drains to buffer zones …………………………………………………………………………………….
Evaluating Effectiveness of SWMP’s • Obstacles to Effective SWMPs • Difficult for stormwater managers to articulate funding needs due to lack of specificity regarding appropriate levels of effort • Some TMDLs may require load reductions that are technically and/or economically unachievable? • A regulatory emphasis is required to increase the outcomes over outputs awareness
Obstacles to Urban Stream Restoration • TMDL implementation feasibility typically unknown • Specific pollution sources uncharacterized • Cheap, fast screening tools often inadequate • Public often uninformed, not involved • Land-use changing faster than assessment methodologies can detect and respond • Environmental budgets depleted, public resources scarce • Costs of restoration versus protection often undefined • Urban stormwater permit implementation – difficult to articulate true requirements
Summary: An EPA Watershed Coordinator's Perspective On Restoration Research Priorities • Low-cost technical and financing assistance for urban stormwater • Models and tools to anticipate water quality degradation trends, both current and predictive • Models and tools to associate restoration costs to development patterns (SMART Growth now or retrofit later) • Research to guide sound water quality trading concepts • Find new mechanisms to collaborate with USDA
Summary: An EPA Watershed Coordinator's Perspective On Restoration Research Priorities • Improved outreach and coordination with land-use planners and decision-makers • Economic incentives for LID and Smart Growth • Green Sustainable Infrastructure • Emphasis on educating citizenry with measurable behavior changes • Mechanisms to ensure that restoration projects are sustainable, maintainable • Others? Of course there are. Help us prioritize!
EPA/ SCDHEC/ SCASM Partnership • SCASM at the table to help define appropriate levels of effort for implementing minimum control measures and implementing TMDLs! • Not meant to be prescriptive, but a good starting point
Emerging Tools and Approaches to Achieve MS4 TMDL Implementation and Urban Watershed Restoration
What is Automated Feature Extraction? Fire Risk • Digital Image Classification & Analysis • to Detect Features Based on – • Pattern Recognition • Spectral Content • Spatial Context • Texture Urban Forestry Forest Biomass Source: www.ncdcimaging.com
Applications Using High-Resolution Urban Land Cover Mapping • Stormwater • City Forestry / CITYgreen • Water Conservation • City & Environmental Planning • Water Quality / Erosion Control • City Parks & Recreation Source: www.ncdcimaging.com
Parcel Analysis Impervious Surfaces Source: www.ncdcimaging.com
Parcel Analysis Tree Canopy Source: www.ncdcimaging.com
Emerging Technology: Calculating Benefits of Tree Cover Source: www.ncdcimaging.com
Urban Forest Assessment, Middleton, Wisconsin CITYgreen Initial Report – Land Cover Class by Acres Reports Acreage & Percentage of all Land Cover Types
Stormwater Quantity (Runoff) Model, Citywide Results Average Rainfall Event Curve Numbers Additional Runoff from Curve Number Change Construction Cost to Build Retention Facility Total Savings Provided by Trees Source: American Forests
L-THIA (Long-Term Hydrologic Impact Assessment) Water Quality Model, Citywide Results Reports Percent Change in Contaminant Loading When Stormwater Increases Source: American Forests
Thermography’s Promise! • Huge potential savings for IDDE programs! • Must fly on clear, cold nights when tree canopy is minimized
Looked at cost savings to development community by reducing impervious paving requirements Should be a NYT Best Seller! Promoting Local Solutions
NOAA Employing AR Techniques to Characterize Pathogen Sources on Kiawah Island Encroaching Development Bass Creek Impaired Shellfish Beds Monitoring Stations EPA Partnering with NOAA and SCDHEC to Develop and Implement Pathogen TMDL
City Of North Augusta Influencing New Construction Projects Abandoned Brick Ponds Constructed Wetlands New Homes Potential 5-Star Grantee SENSA: Local Champion Savannah River
"Not many people have done what we're going to do," said town engineer Jeff McNesby. "But then again, there aren't many bodies of water like the May River."
Linking Enforcement and Compliance Activities to Ambient Water Quality • We need tools to link outputs such as illicit discharge detection reporting to outcomes such as ambient water quality improvement! • EPA R4’s Number One Priority for Water Program Enforcement is STORMWATER!!!
SCDHEC Watershed Coordinators By Basin Watersheds and Planning Contact Information(Program Coordinators, Analysts, and Managers) Section Manager Mihir Mehta 803-898-4011 Watershed Manager - Santee and SalkehatchieAndy Miller 803-898-4031 Watershed Manager - Catawba and EdistoCarol Copeland 803-898-4203 Watershed Manager - Savannah and BroadRichelle Tolton 803-898-4213 Watershed Manager - Pee Dee and SaludaRoger Hall 803-898-4142
Resources and Citations • SCASM!!! • Subwatershed Vulnerability Analysis Tool from Center for Watershed Protection • www.cwp.org/Vulnerability_Analysis.pdf • Methods to develop restoration plans for small urban watersheds from CWP • www.cwp.org • Southeastern Stormwater Association • www.seswa.org • American Forests CITYGreen Tool • www.americanforests.org/productsandpubs/citygreen/ • EPA LID Pages • www.epa.gov/nps/lid/index.html • Saluda-Reedy Watershed Consortium Audit of Pavement Standards • http://www.saludareedy.org/outreach/lid/lidauditweb.pdf
Thank You For Your Time! Craig Hesterlee, South Carolina Watershed Coordinator USEPA Region 4, Watershed Management Office Hesterlee.Craig@epa.gov 404-562-9749