Download

1 / 0
0 likes | 142 Vues
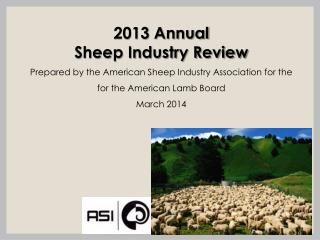
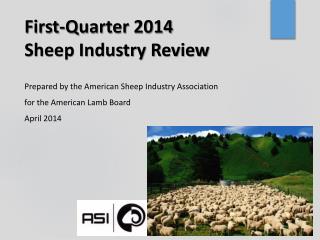
Third-Quarter 2012 Sheep Industry Review Prepared by the American Sheep Industry Association for the American Lamb Board November 2012. Contents Executive Summary Feeder and Slaughter Lamb Market Trends Feeder and Slaughter Lamb Price Projections

E N D