Download
1 / 22
220 likes | 371 Vues
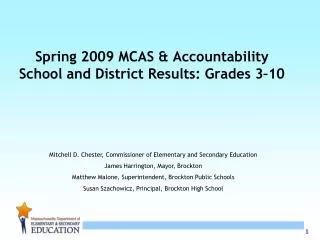
Spring 2009 MCAS & Accountability School and District Results: Grades 3–10. Mitchell D. Chester, Commissioner of Elementary and Secondary Education James Harrington, Mayor, Brockton Matthew Malone, Superintendent, Brockton Public Schools Susan Szachowicz, Principal, Brockton High School.

E N D
Spring 2009 MCAS & AccountabilitySchool and District Results: Grades 3–10 Mitchell D. Chester, Commissioner of Elementary and Secondary Education James Harrington, Mayor, Brockton Matthew Malone, Superintendent, Brockton Public Schools Susan Szachowicz, Principal, Brockton High School
Decade of Progress: Grade 10 MCAS MathPercent Proficient or higher
Decade of Progress: Grade 10 MCAS MathPercent Proficient or higher
Decade of Progress: Grade 10 MCAS MathPercent Proficient or higher
Decade of Progress: Grade 10 MCAS ELAPercent Proficient or higher
Decade of Progress: Grade 10 MCAS ELAPercent Proficient or higher
Decade of Progress: Grade 10 MCAS ELAPercent Proficient or higher
BHS has made great strides on MCAS % of Brockton High students who have already met the minimum state testing requirements for graduation by scoring Needs Improvement or higher on all three grade 10 MCAS tests: Class of 2010: 85% Class of 2011: 75% (after your 1st attempt)
BHS is leading the way • BHS is one of only 8 schools with a low income rate of 60 percent or more where more than 50 percent of students scored Proficient or higher on all three 2009 grade 10 MCAS tests (ELA, Math, Science & Technology/Engineering): • Boston Preparatory Charter Public School • MATCH Charter Public High School • University Park Campus School • City on a Hill Charter Public School • Fenway High School • Revere High School • Codman Academy
2009 MCAS Highlights • Grade 10 students’ performance improved overall and among groups • ELA performance improved in most grades and for all groups • 90% of class of 2010 has already met state’s new graduation requirements • Middle School mathematics needs attention • Fewer than half of all students statewide scored Proficient or higher in grades 7 and 8 • Some gaps have narrowed slightly, but still remain • Formerly Limited English Proficient (FLEP) students continue to make strides
2009 MCAS Highlights • Remarkable turnaround at Grade 10 • English Language Arts • In 1998, 38% scored Proficient or higher • In 2009, 79% scored Proficient or higher • Mathematics • In 1998, 24% scored Proficient or higher • In 2009, 75% scored Proficient or higher
Change in District Performance: ELA Improve = Difference of +3 percentage points or greater in the percent of students scoring at the Proficient & Advanced levels No Change = Difference of between –2 and +2 percentage points Declined = Difference of -3 percentage points or greater
Change in District Performance: Mathematics Improve = Difference of +3 percentage points or greater in the percent of students scoring at the Proficient & Advanced levels No Change = Difference of between –2 and +2 percentage points Declined = Difference of -3 percentage points or greater
Change in District Performance: STE Improve = Difference of +3 percentage points or greater in the percent of students scoring at the Proficient & Advanced levels No Change = Difference of between –2 and +2 percentage points Declined = Difference of -3 percentage points or greater
Change in School Performance: ELA Improve = Difference of +3 percentage points or greater in the percent of students scoring at the Proficient & Advanced levels No Change = Difference of between –2 and +2 percentage points Declined = Difference of -3 percentage points or greater
Change in School Performance: Mathematics Improve = Difference of +3 percentage points or greater in the percent of students scoring at the Proficient & Advanced levels No Change = Difference of between –2 and +2 percentage points Declined = Difference of -3 percentage points or greater
Change in School Performance: STE Improve = Difference of +3 percentage points or greater in the percent of students scoring at the Proficient & Advanced levels No Change = Difference of between –2 and +2 percentage points Declined = Difference of -3 percentage points or greater
2009 NCLB Accountability Highlights • 937 schools (54%) in improvement status in 2009 • Up from 840 (50%) in 2008 • 109 districts (28%) in improvement status • Including 29 charters, 8 voc/techs, and 17 other single-school districts • Up from 89 in 2008 (including 26 charters, 6 voc/techs, and 11 other single-school districts) • 21 schools recognized for exiting accountability status