
Uploaded by
lillian-lancaster
15 SLIDES
303 VUES
150LIKES
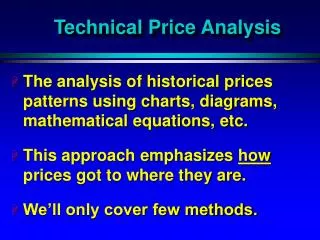
Technical Analysis
DESCRIPTION
Technical Analysis. By Ross Klosterman Common Cents Investment Group. Agenda. What is TA? How do we utilize TA? Sample indicators Interactive exercise Conclusion. What is Technical Analysis?. How is Technical Analysis used?. Charts. Charts. Sample Indicators. Sample Indicators.
Download

1 / 15
Télécharger la présentation 
Technical Analysis
An Image/Link below is provided (as is) to download presentation
Download Policy: Content on the Website is provided to you AS IS for your information and personal use and may not be sold / licensed / shared on other websites without getting consent from its author.
Content is provided to you AS IS for your information and personal use only.
Download presentation by click this link.
While downloading, if for some reason you are not able to download a presentation, the publisher may have deleted the file from their server.
During download, if you can't get a presentation, the file might be deleted by the publisher.
E N D
Presentation Transcript
Technical Analysis By Ross Klosterman Common Cents Investment Group
Agenda • What is TA? • How do we utilize TA? • Sample indicators • Interactive exercise • Conclusion
Conclusion • TA is NOT the end-all-be-all • Combine with FA can be a deadly combo • www.stockcharts.com • What are your questions? Would you like me to give you my opinion on any stock?


More Related