Download
1 / 71
710 likes | 725 Vues
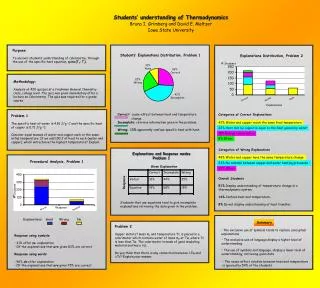
This article discusses the differences between middle school and college-level instruction in physical science, with a focus on classroom management, student motivation, and the effectiveness of hands-on activities. The author shares their observations and experiences from teaching both middle school and college physics classes.

E N D
Physical science instruction and assessment in the middle-school: Comparisons and contrasts with college-level instruction David E. Meltzer College of Integrative Sciences and Arts Arizona State University
Background and Context My experience: 29 years of (mostly) college physics teaching, supplemented by: • One year teaching 8th grade science in private middle school (10 contact hours per week) • Four years teaching weekly science classes to 5th-8th grade students at ASU-sponsored middle school • (80-150 students per week; each student one class hour per week; 3-5 contact hours per week) About 1000 total contact hours teaching middle-school science
Overall Goals • Generate enthusiasm for engaging in science • For 5/6th graders: no problem, they love it • For 7/8th graders: more challenges • Develop abilities for engaging in science • Not formally assessed, but students become habituated to need for arguing from evidence based on experimental observation • Build understanding of science concepts: what are reasonable conceptual goals? • Highly challenging; the focus of this talk
General Issues • Classroom management • Student motivation • Logistics
Classroom Management Issues • If the students are not attempting to participate in class or engage with the activities, they will learn nothing • Learning classroom management skills is done on the job or with previous equivalent experience; it is a highly nontrivial task
General Observations • A lot of hands-on instructor assistance is needed to keep kids on task and on track; • Logistics of handling supplies and maintaining equipment is a major concern; • Written worksheets can be used if they are carefully edited and accompanied by frequent check-ins by the instructor. • Students’ progress toward conceptual learning goals is extremely slow compared to college class
General Impressions of Student Reactions to Activities • College students (pre-service teachers): burdensome tasks that had to be gotten through • College students (STEM majors): generally enjoyable tasks, moderately enthusiastic • 7th/8th graders: Time to socialize with each other; moderate engagement and enjoyment • 5th/6th graders: Playtime: fun and high engagement
Additional Context, 2010-2011 • Generally one instructor, sometimes helped by graduate student aide • Homework assigned and corrected most weeks; occasional quizzes (graded only for 7/8th grade) • In the previous year I had taught many of the same students, including some of the same activities
Topics Covered, 2010-2011 • Grades 7/8: Major focus on motion and force (to prepare for Arizona 8th-grade science test); also did solar system astronomy, electromagnetism, some review of properties of matter, energy concepts, some chemistry • Grades 5/6: solar system astronomy, optics, motion and force, energy concepts, electromagnetism, some biology Small-to-moderate variations on this set of topics during other years, 2009-2013
Topics Covered, 2010-2011 • Grades 7/8: Major focus on motion and force (to prepare for Arizona 8th-grade science test); also did solar system astronomy, electromagnetism, some review of properties of matter, energy concepts, some chemistry • Grades 5/6: solar system astronomy, optics, motion and force, energy concepts, electromagnetism, some biology Small-to-moderate variations on this set of topics during other years, 2009-2013
Motion and Force with 7/8th Graders • Approximately 10-15 hours of activities, beginning with graph paper and stopwatches, moving on to dynamics carts and tracks, fan carts, motion sensors and GLX’s (hand-held graphing computers). • Many of the students had previous experience using GLX for position/time and velocity/time graphs. • Typical sequence: explore with equipment; predict graphs for various motions; carry out series of experiments; describe and report results; explain and generalize.
Goals Tuned to Arizona 8th-Grade Science Standard • Create a graph devised from measurements of moving objects and their interactions, including: • position-time graphs • velocity-time graphs • Describe the various effects forces can have on an object (e.g., cause motion, halt motion, change direction of motion, cause deformation). • Describe how the acceleration of a body is dependent on its mass and the net applied force (Newton’s 2nd Law of Motion).
Cautionary Note: These ideas and skills are challenging for college students • In our studies of college students, we have found that both the mathematical skills and the physical concepts can be challenging to learn and retain • An example from an ongoing study:
Desired answer: 2/3 m/s or 0.67 m/s (Divide “rise” in meters by “run” in seconds) Note: Units missing
Around half of all students ignore numbers on axes, and just count grid squares Most common incorrect answer: 1/3 Correct Response Rate, Arizona State University; Fall 2018 Algebra-based physics course, first semester: 43% (N = 305) Calculus-based physics course, first semester: 56% (N = 329)
Force and Motion Activities • Phase I: Extensive work on kinematics, including position-time and velocity-time graphs using GLX graphing devices • Phase II: Students introduced to measurement of “pushes” and “pulls,” use calibrated spring scales to pull on low-friction carts; measure pushing force of fan cart; • Phase III: Administer and discuss pretest: Students use fan carts to determine shape of velocity vs. time graph of an object being acted upon by a force of unchanging magnitude. • Phase IV: Circular motion activities; marble rolling on circular track with cut-out, analysis of hammer-throw video.
[Pretest] A cart on a low-friction surface is being pushed by a fan mounted on the cart. The instantaneous velocity of the cart is measured throughout a time period, beginning when the cart has already started moving. The experiment is done twice, and the pushing force is 0.1 N for the first trial and 0.2 N for the second. (The mass of the cart is kept the same for both trials.) During each trial the pushing force is constant, so the strength of the push doesn’t change while the cart moves along the track. On a single set of v-t axes, sketch the appropriate lines for velocity versus time for the two trials, and label them 0.1 N and 0.2 N.
velocity 0.2 N 0.1 N time A cart on a low-friction surface is being pulled by a string attached to a spring scale. The velocity of the cart is measured as a function of time. The experiment is done three times, and the pulling force is varied each time so that the spring scale reads 1 N, 2 N, and 3 N for trials #1 through #3, respectively. (The mass of the cart is kept the same for each trial.) On the graph below, sketch the appropriate lines for velocity versus time for the three trials, and label them #1, #2, and #3.
Pretest response: ~50% velocity 0.2 N 0.1 N time A cart on a low-friction surface is being pulled by a string attached to a spring scale. The velocity of the cart is measured as a function of time. The experiment is done three times, and the pulling force is varied each time so that the spring scale reads 1 N, 2 N, and 3 N for trials #1 through #3, respectively. (The mass of the cart is kept the same for each trial.) On the graph below, sketch the appropriate lines for velocity versus time for the three trials, and label them #1, #2, and #3. [or with order inverted]
Pretest Response: ~50% velocity 0.2 N 0.1 N time A cart on a low-friction surface is being pulled by a string attached to a spring scale. The velocity of the cart is measured as a function of time. The experiment is done three times, and the pulling force is varied each time so that the spring scale reads 0.1 N, 0.2 N, and 0.3 N for trials #1 through #3, respectively. (The mass of the cart is kept the same for each trial.) On the graph below, sketch the appropriate lines for velocity versus time for the three trials, and label them #1, #2, and #3. [or with order inverted]
Assessment Issues • Different types of questions have advantages and disadvantages • Need for practicality and efficiency of grading can conflict with desire for in-depth probes of student thinking • Risky to draw conclusions about students’ performance without at least some “explain your answer” types of questions
Question Types • Multiple-choice questions can be efficient to administer and grade, but: • they require careful design and revision to avoid ambiguous or misleading statements • “correct” answers can obscure a great deal of actual confusion • “Free-” or “Open-response” questions can reveal details of students’ thinking, but they: • require careful design to provide adequate guidance • are time-consuming to answer, grade, and analyze
Item Taken from Widely Distributed Diagnostic Test At constant speed??
Grade 7/8 Results for Mechanics Instruction • Good and consistent performance on position/time graphs
Grade 7/8 Results for Mechanics Instruction • Good and consistent performance on position/time graphs • On velocity/time graphs, 40-50% qualitatively correct, 15-30% quantitatively correct
Grade 7/8 Results for Mechanics Instruction • Good and consistent performance on position/time graphs • On velocity/time graphs, 40-50% qualitatively correct, 15-30% quantitatively correct • On acceleration graphs and force questions, 15-30% correct, 10-20% correct with correct explanations. • Overall impressions: State science standards are unrealistic, at least regarding mechanics
[A comment on NGSS…] Disciplinary Core Ideas PS2.A: Forces and Motion • The motion of an object is determined by the sum of the forces acting on it; if the total force on the object is not zero, its motion will change. The greater the mass of the object, the greater the force needed to achieve the same change in motion. For any given object, a larger force causes a larger change in motion.
Disciplinary Core Ideas PS2.A: Forces and Motion • The motion of an object is determined by the sum of the forces acting on it; if the total force on the object is not zero, its motion will change. The greater the mass of the object, the greater the force needed to achieve the same change in motion. For any given object, a larger force causes a larger change in motion.
Students who demonstrate understanding can: Plan an investigation to provide evidence that the change in an object’s motion depends on the sum of the forces on the object and the mass of the object. What is that? How does one measure it?
Rubric Grading • Even on quantitative questions, it’s often useful to insert qualitative items and award correct answers with partial credit. • Example: Question on measuring power, for high school students in summer program carrying out lab activities
Which cart uses the most power? Relevant quantities: mass (m); time (t); velocity (v) kinetic energy (KE) = ½ mv2 Power = change in energy, divided by time =Δ/Δ
c c