Download
1 / 16
160 likes | 295 Vues
THE CONTRIBUTIONS OF CIMAS TO THE EVOLUTION OF PRESENT NOAA AND CLIVAR CLIMATE REQUIREMENTS. OUTLINE. NOAA CLIMATE REQUIREMENTS CLIVAR PRINCIPLE RESEARCH AREAS PREDECESSORS TO PRESENT NOAA AND CLIVAR PROGRAMS INVOLVING CIMAS PARTICIPATION EXAMPLES OF OUTSTANDING CIMAS

E N D
THE CONTRIBUTIONS OF CIMAS TO THE EVOLUTIONOF PRESENT NOAA AND CLIVAR CLIMATE REQUIREMENTS
OUTLINE • NOAA CLIMATE REQUIREMENTS • CLIVAR PRINCIPLE RESEARCH AREAS • PREDECESSORS TO PRESENT NOAA AND CLIVAR PROGRAMS INVOLVING CIMAS PARTICIPATION • EXAMPLES OF OUTSTANDING CIMAS CONTRIBUTIONS TO PREVIOUS CLIMATE STUDIES AND THE EVOLUTION OF PRESENT REQUIREMENTS
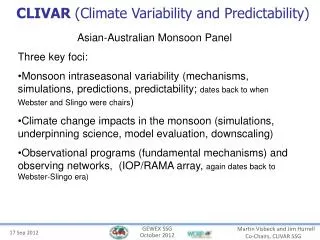
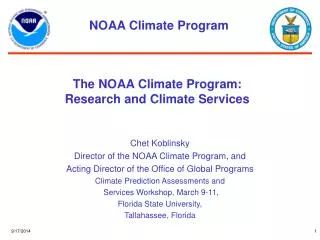
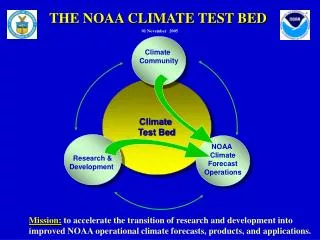
NOAA CLIMATE REQUIREMENTS Goal 1: Improved Intraseasonal to Interannual Forecasting Capability. Provide national and regional managers with timely and accurate climate information and forecasts to enable them to better plan for the impacts of climate variability and change. Goal 2: Improved National and International Assessments to Support Policy Decisions.Provide national and regional policy makers with improved knowledge the effectively communicates probabilities and/or reduces the uncertainties associated with climate variability and change and provides objective information for adaptation in the context of multi-resource management and sustainability. Goal 3: Improved Climate Observations, Monitoring and Data Management.Build the climate observing system required to support the research, modeling, and decision support activities for the Climate Change Research Initiative.
G1: ENSO EXTENDING AND IMPROVING PREDICTIONS Fig. 1.1: Schematic diagram of the ENSO cycle (courtesy of NOAA/PMEL). • CLIVAR PRINCIPLE RESEARCH AREAS
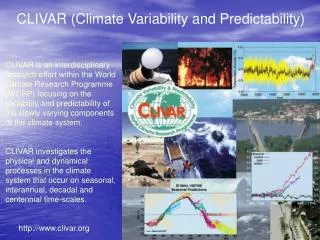
CLIVAR Atlantic Principle Research Areas • D1: The North Atlantic Oscillation • D2: Tropical Atlantic Variability • D3: Atlantic Thermohaline • Circulation
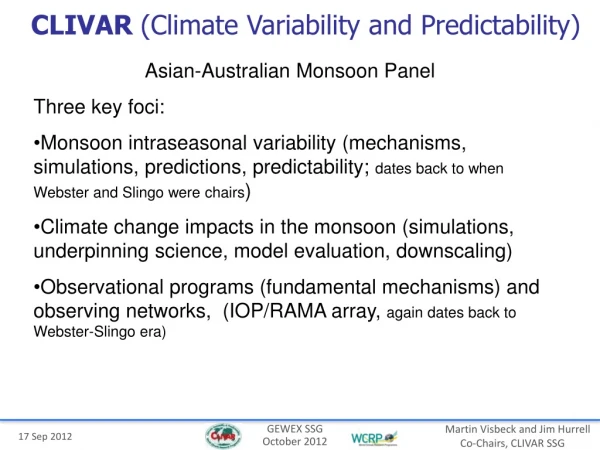
The CLIVAR Anthropogenic Climate Change Programme encompasses two Principal Research Areas • A1: Climate Change Prediction • A2: Climate Change Detection & Attribution
1980 EQUATORIAL PACIFIC OCEAN CLIMATE STUDY (EPOCS) T I M E TROPICAL OCEAN GLOBAL ATMOSPHERE (TOGA) CLIMATE VARIABILITY (CLIVAR) G1. ENSO: EXTENDING AND IMPROVING PREDICTIONS • NOAA-CLIMATE • INTRASEASONAL TO • INTERANNUAL FORECASTING • 2) PAN AMERICAN CLIMATE • STUDIES (PACS) Present
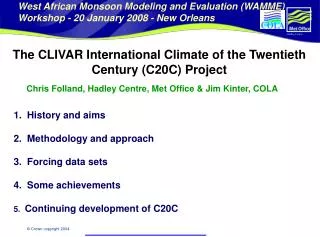
1980’S Subtropical Atlantic Climate Studies (STACS) WESTERN TROPICAL ATLANTIC EXPERIMENT (WESTRAX) ATLANTIC CLIMATE CHANGE PROGRAM (ACCP) T I M E ATLANTIC CLIMATE VARIABILITY EXPERIMENT (ACVE) NORTH BRAZIL CURRENT RING EXPERIMENT NOAA - CLIMATE 1) INTRASEASONAL – INTERANNUAL FORECASTING 2) CLIMATE ASSESSMENTS 3) CLIMATE OBSERVATIONS CLIMATE VARIABILITY (CLIVAR) ATLANTIC D1) NORTH ATLANTIC OSCILLATION D2) TROPICAL ATLANTIC VARIABILITY D3) ATLANTIC THERMOHALINE CIRCULATION Present
TIME OCEAN-ATMOSPHERE CARBON EXCHANGE STUDY (OACES) T I M E GLOBAL CARBON CYCLE CLIMATE VARIABILITY (CLIVAR) ANTHROPOGENIC CLIMATE CHANGE A1: Climate Change Prediction A2: Climate Change Detection and Attribution NOAA CLIMATE ASSESSMENTS Present
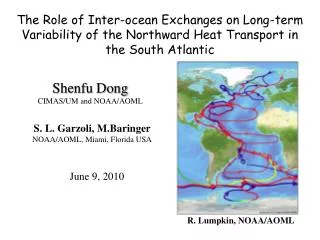
Time series of Florida Current transport inferred from the cable voltages including (a) the daily transport values (blue line), (b) the monthly average transport, and (c) the two year running means of the daily transport values (solid line). Panel (c) also includes the monthly mean NAO index (Hurrell, 1995) (dashed red line). Panel (a) includes in situ observations of Florida Current transport obtained on small boat cruises (solid circles).
Time series of T, S and depth along a density surface representing the Labrador Sea Water obtained from historical data collected east of Abaco Island, Bahamas. A pronounced cold, fresh pulse of Labrador Sea water appeared in 1995, less than eight years after it was produced in the Labrador Sea. Results indicate a faster “Conveyor Belt” than previously thought.
Seasonal cycle in Deep Western Boundary Current discovered North Atlantic Deep Water flow at the equator (mean from moored WESTRAX array data) Seasonal deep transport variability(from min of <5 Sv in Nov. to max of ~20Sv in Feb.,) seasonal harmonic fits for two separate mooring deployments Fischer and Schott, JGR 1997
SUMMARY Results from CIMAS Research activities have provided framework for present-day NOAA Climate and Clivar Requirements Much of the success is due not only to the local collaborations but also to the National and international interactions resulting from the CIMAS Programs As will now be demonstrated, these multi- level interactions will continue to respond to evolving NOAA Climate needs