Descriptive Evaluation
Descriptive Evaluation Dependent (Response) Variable – the results of your operational definition will be data -- data represent variables, the values have a “life” and a “meaning” Scales of Measurement – determines information available and how we can treat the data

Descriptive Evaluation
E N D
Presentation Transcript
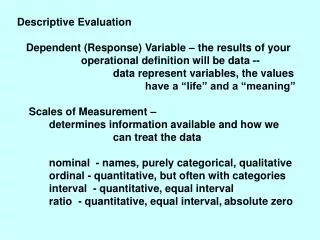
Descriptive Evaluation Dependent (Response) Variable – the results of your operational definition will be data -- data represent variables, the values have a “life” and a “meaning” Scales of Measurement – determines information available and how we can treat the data nominal - names, purely categorical, qualitative ordinal - quantitative, but often with categories interval - quantitative, equal interval ratio - quantitative, equal interval,absolute zero
Dependent Variable Stay or Leave Abusive Relationship Treatment Outcome –worse, no change, better Letter Grade Received in Course Rated attractiveness on 11 point scale very unattractive (0) to very attractive (11) Minutes to Complete a Task
Dependent Variable (from manuscript reviewed) – time want to spend with a blind date 0 minutes 15 minutes 30 minutes 60 minutes 120 minutes Underlying dimension is time – which is on what scale? How would you ‘treat’ this variable, based on their format – what scale?
Describing Data sets - organize and summarize organize “internal organization/structure” summarize by reducing to indices Options will depend partially on Scale of Measurement Organize Tables and Graphs - Frequency Table - simple count of all values Bar Graph - best if small number of possible values Histogram - will group when many values Stem & Leaf - groups, but retains more of values Box plots - gross summary
What do these data say? Scores of 0 and 10 not possible Rating on 9-point scale, Definitely No (1) to (9) Definitely Yes “Is person likely to have a relapse?”
What do these data say? Scores of 650 possible – but there are none Now have ‘groupings’, not individual scores, since so many possible values. Can ‘see’ the organization of the data, but have lost some information.
What do these data say? Rate – How upset would you be if you found out your partner had been sexually unfaithful On a 9 point scale – Not at all (1) to (9) Extremely
Summarize- to describe sample or compare samples Central Tendency – “typical” value in the set mode – most frequent median – central value in ordered set mean – mathematical midpoint M = S (x)/df ? Appropriateness/Advantages/Disadvantages of each
Variability – differences within the data set • range – • difference between highest - lowest • inter-quartile range – uses median • distance between 25th and 75th percentile scores (middle 50%) • variance – • mean squared deviation from mean (MS) • S (x-M)2/df • standard deviation – • “mean” deviation from mean (RMS) • Note that Variance and Standard Deviation are means (typical values)
How well can these “Summary Statistics” describe the data set? If you can assume a “Normal” Distribution of the data, you can ‘reconstruct’ the data set from the two ‘descriptive statistics’ (and you know calculus) If the shape is not ‘normal’, but is relatively ‘smooth’, can increase accuracy of reconstruction using other descriptive statistics.
Less Common Descriptive Statistics Skewness – symmetry of the two tails Kurtosis – ‘peakedness’ of the distribution
Data from four questions of a survey on which participants rated their views on a 9-point scale from “Definitely No” (1) to “Definitely Yes” (9). x x x x x x x x x x x _________________________ 1 2 3 4 5 6 7 8 9 x x x x x x x x x x x_________________ 1 2 3 4 5 6 7 8 9 x x x x x x x x x x x___________________________ 1 2 3 4 5 6 7 8 9 x x x x x x x x x x x________ 1 2 3 4 5 6 7 8 9
Population- behavior or data of interest Sample – behavior or data set available (selected from population – how? subject to sampling error) Organize – picture and describe the complete data set Summarize – reduce data set to the ‘typical’ characteristics, characterize qualities of the entire set (statistic) Generalize – draw inferences about the population (parameter)
What can sample reveal about population – Generality of the information from the sample Based on the sample Mean, the Population Mean is …. point estimation – use sample Mean as estimate of ‘true’ population Mean – signal, ignores noise Assume assess attitudes toward War Totally Oppose 1 2 3 4 5 6 7 8 9 10 11 Totally support Collect data from a sample, and find M = 6 What inference would you make about the attitude in the Population?
What can sample reveal about population – Generality of the information from the sample Based on the sample Mean, the Population Mean is …. point estimation – use sample Mean as estimate of ‘true’ population Mean interval estimation – use sample Mean and sample SD to estimate range (based on SE) within which the population mean is ‘likely’ to fall Confidence Intervals (at some %)
The population from which these samples were drawn has a range of possible scores from 1 to 11, with a mean score of 6. • Sample Size • 5 10 30 100 1000 • Sample 1 4.2 4.6 6.2 5.7 6.1 • 2 5.0 4.9 6.2 5.9 5.9 • 3 5.8 5.0 6.1 6.1 6.1 • 4 5.8 5.3 6.1 6.0 5.9 • 5 6.2 6.1 6.1 5.7 6.2 • 6 6.2 6.3 5.9 5.7 6.0 • 7 6.2 6.4 5.9 6.2 6.1 • 8 6.4 6.5 6.2 5.8 6.1 • 9 6.4 6.6 5.6 6.0 6.0 • 10 8.0 7.0 5.8 5.8 6.1 • Mean of 10 6.02 5.87 6.01 5.89 6.05 • samples • std error of mean .98 .84 .20 .17 .08 • 95% conf 4.10-7.94 4.22-7.52 5.62-6.40 5.56-6.22 5.89-6.21 intervals • + 1.96 sem
Descriptive Statistics can also be used to characterize individuals within the data set Standardized scores assess relative position of an individual z score = (x – M)/SD individual deviation from mean typical deviation from mean for the group resulting set of z scores will have: mean of set of z scores = 0 variance and standard deviation = 1 shape of distribution of z’s will match shape of raw scores How would you feel about an exam z-score of +2.0?
Standard Normal Distribution – normal distribution of z scores (popular with statisticians) if scores are from a normal distribution, has useful properties many stats tests are based on this because it has fixed properties simpler, predictable is it ‘realistic’ to assume normal distributions? (sampling distributions)
To ‘truly’ know the Population parameter – best estimate Need to draw repeated samples from the population Sampling Distribution – theoretical distribution of a statistic based on some sample size (n), assuming ALL POSSIBLE random samples of size n are drawn
Central Limit Theorem – as sample size increases, distribution of ‘statistic’ approaches a normal distribution For example sampling dist of mean will become normal as sample size increases, no matter what the shape of the distribution of actual scores. mean of distribution will have mean equal to the ‘true’ mean of the raw scores standard error is the measure of variability of the statistic (across samples) ‘comparable’ to the standard deviation of individual scores
Based upon this distribution, can get idea about likely accuracy of sample estimates of population parameters with large samples (30+), Sampling Distribution Mean + 1.65 std error will include 90% of sample means Sampling Distribution Mean + 1.96 std error will include 95% of sample means Sampling Distribution Mean + 2.58 std error will include 99% of sample means Where values are based on z scores (1.65, 1.96, 2.58) *with smaller sample, use t-value for the sample size to determine cut-offs for %
Exploratory Data Analysis – are data ‘appropriate’ for analyses What ‘assumptions’ must be met for analysis? Examine the data for errors and anomalies are data ‘non-normally’ distributed are there outliers are there missing data
Interpreting Skewness and Kurtosis in SPSS reported as ‘z-score’ equivalents determining degree of deviation from normal
Dealing with Missing Data Why is it missing? Comparing those with missing data to those without Replacing missing data? Impact of missing data in SPSS pairwise vs. listwise analyses