Download
1 / 13
150 likes | 440 Vues
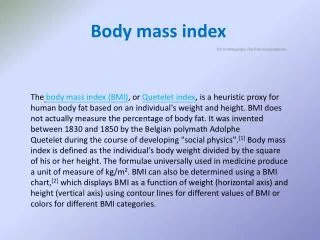
BODY MASS INDEX (B.M.I.). Calculating B.M.I. Weight (kg) = B.M.I. (kg/m 2 ) Height 2 (m 2 ). Interpreting B.M.I. < 18 = Underweight 20-25 = Normal range 25-30 = Overweight 30-35 = Obese (Grade I) 35+ = Obese (Grade II). B.M.I. Graph.

E N D
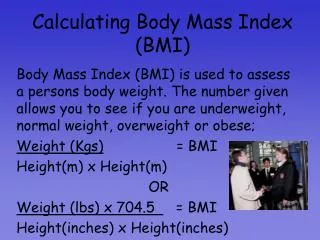
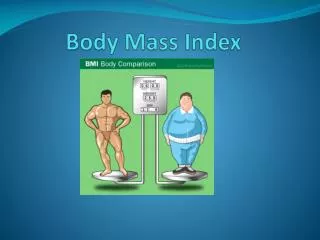
Calculating B.M.I. Weight (kg) = B.M.I. (kg/m2) Height2 (m2)
Interpreting B.M.I. • < 18 = Underweight • 20-25 = Normal range • 25-30 = Overweight • 30-35 = Obese (Grade I) • 35+ = Obese (Grade II)
Stature-for-age/Weight-for-age– BOYS – 2 to 20 years Growth Charts - Percentiles
Length-for-age/Weight-for-age– BOYS – Birth to 36 months Growth Charts - Percentiles
Head circumference-for-age/Weight-for-length- BOYS – Birth to 36 months Growth Charts - Percentiles
Weight-for-stature– BOYS Growth Charts - Percentiles
Length-for-age/Weight-for-age– GIRLS – Birth to 36 months Growth Charts - Percentiles
Stature-for-age/Weight-for-age– GIRLS – 2 to 20 years Growth Charts - Percentiles
Head circumference-for-age/Weight-for-length – GIRLS – Birth to 36 months Growth Charts - Percentiles
Weight-for-stature– GIRLS Growth Charts - Percentiles
Online B.M.I. Calculator • Link to this website for a B.M.I. Calculator: Click here